
PIVOT and UNPIVOT reshape SQL Server data, but UNPIVOT does not restore rows lost through aggregation. PIVOT and UNPIVOT were introduced in SQL Server 2005 and remain available in later releases.

Related PIVOT and UNPIVOT Examples
The following SQLAuthority examples cover the related operators:
SQL SERVER – PIVOT and UNPIVOT Table Examples.
SQL SERVER – PIVOT Table Example.
SQL SERVER – UNPIVOT Table Example.
Where PIVOT and UNPIVOT lose information
PIVOT groups the remaining input columns and aggregates each chosen category. Choose the intended row grain before pivoting. An extra identifier in the input can produce extra groups. The fixed IN list defines output columns; a newly appearing category does not automatically add another column.
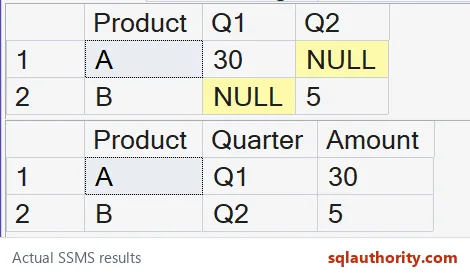
The example below has four source rows. Product A has two Q1 amounts, 10 and 20, and an explicit NULL Q2 amount. Product B has only a Q2 amount of 5. The pivot produces A with 30 and NULL, and B with NULL and 5. UNPIVOT then emits only A/Q1/30 and B/Q2/5.
A complete temporary-table example
SET NOCOUNT ON;
IF OBJECT_ID('tempdb..#CrossTabSales') IS NOT NULL
    DROP TABLE #CrossTabSales;

CREATE TABLE #CrossTabSales
(
    Product varchar(10) NOT NULL,
    Quarter char(2) NOT NULL,
    Amount int NULL
);
INSERT #CrossTabSales (Product, Quarter, Amount)
VALUES ('A','Q1',10), ('A','Q1',20),
       ('A','Q2',NULL), ('B','Q2',5);

SELECT Product, [Q1], [Q2]
FROM
(
    SELECT Product, Quarter, Amount FROM #CrossTabSales
) AS source_rows
PIVOT
(
    SUM(Amount) FOR Quarter IN ([Q1], [Q2])
) AS p
ORDER BY Product;

SELECT Product, Quarter, Amount
FROM
(
    SELECT Product, [Q1], [Q2]
    FROM
    (
        SELECT Product, Quarter, Amount FROM #CrossTabSales
    ) AS source_rows
    PIVOT
    (
        SUM(Amount) FOR Quarter IN ([Q1], [Q2])
    ) AS p
) AS totals
UNPIVOT
(
    Amount FOR Quarter IN ([Q1], [Q2])
) AS u
ORDER BY Product, Quarter;

DROP TABLE #CrossTabSales;
SUM combines A’s two Q1 rows into 30. UNPIVOT cannot recover the original 10 and 20. It also removes NULL cells. The NULL created for an absent category is indistinguishable here from an explicitly NULL aggregate. This is why calling UNPIVOT the exact reverse is misleading.
On the tested SQL Server 2025 instance, the two result grids match these values. The temporary table was removed and no transaction remained open. The native SSMS image shows the main example.

Conditional aggregation for fixed columns
Run this query in the same script, after inserting the sample rows and before the final DROP TABLE. It expresses the same two SUM totals without the PIVOT operator. Leaving out ELSE zero preserves the NULL total when a group has no non-NULL amount for that category.
SELECT Product,
       SUM(CASE WHEN Quarter = 'Q1' THEN Amount END) AS Q1,
       SUM(CASE WHEN Quarter = 'Q2' THEN Amount END) AS Q2
FROM #CrossTabSales
GROUP BY Product
ORDER BY Product;
Conditional aggregation expresses fixed-column totals without PIVOT. The script above uses current setup syntax and was tested on the current engine. That test does not establish compatibility with earlier engine versions.
Check the requested report shape first
Reports may require changing dates, repeated labels and several values per group. Start with representative data and an exact expected output. Define the aggregate and row keys. For dynamic columns, validate category identifiers and keep data values parameterized. UNPIVOT input columns also need compatible data types.
Start from the report shape you need, then choose the operator.
UNPIVOT is not the reverse of PIVOT, it is a new reshape of what remains.
Published by Pinal Dave on SQLAuthority. More of my work at pinaldave.com.
Discover more from SQL Authority with Pinal Dave
Subscribe to get the latest posts sent to your email.




11 Comments. Leave new
my problem is:
1 table store IDNo, ItemName,itemvalue,itemamount.
other table store IDNo,tax1,tax2,party1,party2,party3,
I went to show like this
party1 party2 party3
itemname 200 210 220
tax1 10 11 12
tax2 1 3 4
but I try not do liks this .
if any solution please tell me.
dinesh
You need to post some data as well as expected result to help you
I have this type of Data:
Here Investigation Date is Combo-Box, where date can be selected:
——————————————————————————————
Investigation Date 21/09/2011
——————————————————————————————
Test Name Result Unit Range Comments
——————————————————————————————
Blood Test 1.5mg mg 1.0-2.5 —–
Blood Test 2.0mg mg 1.0-2.5 —–
Urine Test 7.5mg/dl mg/dl 4.0-15.5 —–
——————————————————————————————
See Above 2 Blood test are inserted, While first test is done on 21/09/2011 & second on 25/09/2011.
And Urine Test Done on 25/09/2011.
While i had use this access query in VB.Net coding Directly which runs successfully.
========================================================
Access Query:
TRANSFORM First(dtInvestigation.InvValue & ‘ ‘& InvUnit) AS FirstOfInvId SELECT mstInvestigation.InvstName FROM dtInvestigation INNER JOIN mstInvestigation ON dtInvestigation.InvId = mstInvestigation.InvstId Where dtInvestigation.InvDate Is Not Null and Patid=1 GROUP BY mstInvestigation.InvstName PIVOT (dtInvestigation.InvDate) as pvt;
========================================================
*** Now i want the data like this ***
——————————————————————————————
Test Name 21/09/2011 25/09/2011
——————————————————————————————
Blood Test 1.5mg 2.0mg
Urine Test 7.5mg/dl
——————————————————————————————
Please make it fast and send me the reply as soon as possible
You can reply me here :- [email removed]
Regards,
Amit Uttekar
[email removed]
Iwant to display report as same column name (repeat)and diffrent fields are display in diffrent column by using pivot. what can Ido?
select * from (SELECT DISTINCT(T.VCH_YEAR),CONVERT(VARCHAR,T.NUM_QUANTITY)+T.VCH_UNIT AS QUANTITY ,CONVERT(VARCHAR,M.DTM_PLAN_APPROVAL,106) AS DTM_PLAN_APPROVAL FROM M_MIS_MININGPLAN_ML M,T_MIS_MININGPLAN_ML T
WHERE M.INT_MP_ID=T.INT_MP_ID AND M.BIT_DELETED_FLAG=0 AND T.BIT_DELETED_FLAG=0 and m.INT_CIRCLE_ID=7 AND T.INT_MINERAL_ID=13 AND M.INT_LESSEE_ID=271
GROUP BY VCH_YEAR,CONVERT(VARCHAR,T.NUM_QUANTITY)+T.VCH_UNIT,DTM_PLAN_APPROVAL )
gettable PIVOT (Max(DTM_PLAN_APPROVAL) FOR QUANTITY IN
(Can i write theselect statement here.))AS riii
Hi and thanks for all the great information! I have a scenario I need help with and I am hoping you can help me out.
I have a table that looks like this;
EMP NAME | STAT NAME | STAT | WEEK
“JACK” | “NUMBER OF VISITS” | 12 | 1
“JACK” | “NUMBER OF VISITS” | 22 | 2
“SUSAN” | “NUMBER OF CALLS HANDLED” | 125 | 1
“SUSAN” | “NUMBER OF CALLS HANDLED” | 105 | 2
My problem is that I need to return a single row for each “Stat Name” per employee so that my data set would look like this;
EMP NAME | STAT NAME | WEEK 1 | WEEK 2
“JACK” | “NUMBER OF VISITS” | 12 | 22
“SUSAN” | “NUMBER OF CALLS HANDLED” | 125 | 105
I am kinda lost on what the right thing to do is to get this type of result. Any suggestions?
Thanks in advanced!
I Have One Query
I want to Dispaly Out Put as like
agentId | Mon | tue | wed | thur | fri | sat | sun
1 5 pm 5 pm 5 pm 5 pm 5 pm 5 pm 5 pm
======================================
My Table like this
CREATE TABLE [dbo].[CRMScheduleMaster](
[ScheduleID] [int] IDENTITY(1,1) NOT NULL,
[AgentID] [int] NOT NULL,
[WeekID] [int] NULL,
[StartTime] [varchar](50) NULL,
[EndTime] [varchar](50) NULL,
CONSTRAINT [PK_ScheduleMaster] PRIMARY KEY CLUSTERED
(
[ScheduleID] ASC
)WITH (PAD_INDEX = OFF, STATISTICS_NORECOMPUTE = OFF, IGNORE_DUP_KEY = OFF, ALLOW_ROW_LOCKS = ON, ALLOW_PAGE_LOCKS = ON) ON [PRIMARY]
) ON [PRIMARY]
================
So pls Give the Solution.
Mu\y Id is : [email removed]
i reallly want your help in makin a cross tab query … here is the
scnerio . plzzz help me ….
there are many tables .
tb
datatype
sno autogenerate , date varchar(16) , time varchar(10) ,rhrs int,
sno date time rhr_s
1 26/01/2012 07.00 2801
1 26/01/2012 08.00 2802
1 27/01/2012 09.00 2803
1 27/01/2012 10.00 2804
tb1
datatype
sno autogenerate , date varchar(16) , time varchar(10) ,rhr_s1 int,
sno date time rhr_s
1 26/01/2012 07.00 2801
2 26/01/2012 08.00 2802
3 26/01/2012 09.00 2803
4 26/01/2012 10.00 2804
5 27/01/2012 07.00 2811
6 27/01/2012 08.00 2812
7 28/01/2012 09.00 2813
8 28/01/2012 10.00 2814
tb2
datatype
sno autogenerate , date varchar(16) , time varchar(10) ,rhr_s2 int,
sno date time rhr_s2
1 26/01/2012 07.00 2811
2 26/01/2012 08.00 2812
3 27/01/2012 09.00 2813
4 27/01/2012 10.00 2814
i want a crross tab in this way in date format randomly no fixed date
**cols ————–26/01/2012—————————-27/01/2012
—————— 28/01/2012**
rhr_s–(max-min where date = 26/01/2012) (max-min where date =
27/01/2012) (same formula)
rhr_s1 as above as above
as above
rhr_s2 as above as above
as above
please help me in making this type of report …..
i reallly i trouble
hi sir plz help for this problem
In my table the values are stored as
empid ename date status
————————————————
101 abc 01/02/2013 present
101 abc 02/02/2013 present
101 abc 03/02/2013 absent
102 xyz 03/02/2013 present
and so onnnn
101 abc 28/02/2013 present
102 xyz 28/02/2013 present
here i mention only one employe record.There is n number employes there my problem is
how to show table like this
empid ename 1 2 3 4 5 6 …….28
————————————————————————
101 abc present present absent…………. presnt
102 xyz present present present………..present
here 1 2 3 4 represent dates of the month.
plese kindly provide me the query to get like this.
thanks.
in the above case the empid is also varchar
If you want multiple PIVOT columns, you can use this procedure
https://madhivanan.wordpress.com/2017/07/06/dynamic-crosstab-with-multiple-pivot-columns/