
Blogging has never been an easy task. With close to 9 years of non-stop learning and sharing has got me into a rhythm that I rarely miss a single day without writing one. Over these years, there is one topic area that gets most number of hits based on subject. It is invariably around the performance and troubleshooting area. Most hits on the blogs are always around these areas. Though I see this is proven and become mature over years, still people are searching for topics that are common and even proven over the years.
This always baffles me on the access pattern and I wondered what could be done to mitigate such queries from budding new age DBAs. At the recent SQLPass conference I met a number of them who came to me asking how to become an effective DBA. I generally try to understand their patterns and look for solutions. One of the DBAs told me he was under constant pressure because the SQL Server used to run fine start of the week and the end users complain that the servers are unresponsive or the performance is not acceptable over the week. He was getting clueless to why this behavior was happening. He wanted some help here and I was clueless what to suggest.
Getting started with SQL Diagnostic Manager 10.0
I was recently trying to play with a number of tools in the market and I bumped into IDERA’s SQL Diagnostic Manager tool. They were releasing the new version and I wanted to see how it was different. The first thing that struck me was the ability for DBAs and developers to create automated baselines. This was the first thing that got me by surprise because this requirement was fresh on my mind from the recent trip.
After installation, get to the properties page of the server and go to the “Baseline Configuration” tab. This brings the ability to set automated backups through the week. In the below case, I have gone ahead a created through the week from 8AM – 6PM. This is exactly the timeframe the production is at the maximum stress levels.

What to monitor?
The next phase is to know what we are going to monitor. I saw the “Analysis Configuration” section has the settings already available with pre-set configuration. In the example below, I have used the “Online Transaction Processing” and selected some of the readily available “Categories”. I personally felt such jump start configurations can surely help and guide the new DBAs who are clueless about what is happening in the system.

What I would have loved to see few tooltips while I select each of the categories. Because it would become easy before doing any selection. Having said that, it was pretty easy for me to make the selections as it was almost self explanatory.
While selecting the “Advanced settings”, I was able to see further settings that were interesting. I was able to see some of the rules that can be run by default or can be blocked for analysis. Some of these rules are pretty advanced and interesting because it can be easily missed out in the normal run. Here some of the tempdb rules caught my eyes and I have shown below for reference.

If that was not enough, in “Filter Settings” we can remove unnecessary databases or add multiple databases of our choice. This is powerful because in servers that are consolidated, we don’t need to worry about analyzing smaller databases but the databases of interest based on application can be worked out.

I just wish this had some way to customize some of the rules rather than being fixed. But the 100’s of rules already available are pretty exhaustive to start. I am sure an advanced user will piggyback on some of them. Cases like number of VLFs created are different between versions and sometimes obsolete in newer versions.
Web is the new SSMS
Though the desktop version is powerful and has tons of reports to show by default, I think the web interface has improved by leaps and bound in this release for SQL Diagnostic Manager. The web interface to the monitoring server can reveal insights remotely too without installation requirement. The initial install of 220+MB file and configuration can sometimes be daunting and once configured, we can use the friendly web interface to visualize what is happening on the server.
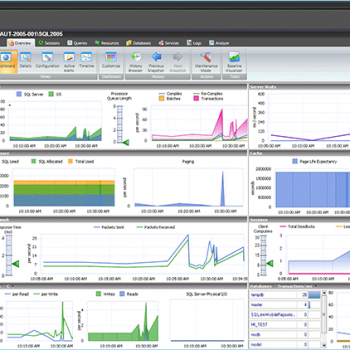
Below is a typical workload that you see that my server suddenly peaked in the late evening when a batch service got initiated. This is typically how people would see their server’s vital stats remotely to check if something is going wrong.

When such anomalies are detected, we can get into the “Top N” queries to see what is going wrong. Which databases are causing heavy workload. Which queries are consuming lots of reads / writes in the system. I felt this snapshot was very useful and made a lot of sense.

Attention to detail like – “When the last autogrowth happened” is something that I felt was quite useful. From the above, I can also see that a lot of tempdb activity is currently in the system that makes me understand how the developers have written their code and where I need to do the optimizations.
Self-Service the new silver-bullet
Though I was planning to wrap up this blog, I found a unique customization feature that caught my eyes and needed a mention here. You can build your very own dashboards using the metrics that have been collected before. The usual performance counters are already available from the web version and building your own dashboard with widgets configuration. As you can see I am taking something simple as a dashboard, but these can show the health of multiple instances across the network based on the configuration.

This ability to have a central web view to all the servers a DBA needs to monitor is critical in large installations and setups where DBAs need to monitor at least 8-10 servers at any moment of time.

Above is a classic example of how I have created my own SQLAuthority dashboard based on the servers that are of interest to me. I am sure your views are going to be complex and complete.
As I conclude, I will let you try the analysis tool which gives some ready solutions to some of the most common problems. There are many more options that are getting added. As I started with the baseline, let me see how the baselines have been performing over the week using their “Baseline Visualizer”.

I am sure you will find some of these interesting and will share your experience as you play around with the tool. Do let me know via comments on what you found interesting.
Reference: Pinal Dave (https://blog.sqlauthority.com)


2 Comments. Leave new
Hi, Which software this? SQLDATA? I am also in server monitoring, I am have my own company with 40+ people working for server monitoring
thanks for sharing your blog,
sir please tell that which S/W is this?