
ASYNC_NETWORK_IO wait stats mean SQL Server has results ready and is waiting for the application to read them. The client isn’t taking the rows as fast as SQL Server sends them. The query can still have more rows to produce once the client catches up. Despite the name, the network is rarely the cause.

This post is part of my wait stats series, told as one story at the Clipboard Diner. Every post is listed in the series guide.
Night 21 at the Clipboard Diner
The caterer’s curtain was gone. The pepper sauce now came in labeled jars on an open shelf. The kitchen felt lighter. At 7:30 PM the line was moving fast. Ace slid three plates of lentil loaf under the sign that says Pick Up Hot and rang the bell.
Nobody came. Quinn was at table 4 with a booth of regulars, telling the story about the deer on the highway. It’s a long story, and Quinn tells it well. Quinn came back, took one plate, and walked it out. Then Quinn told one more part of the story before coming back for the second plate.
The pass holds eight plates. By 7:50 it was full. Now Ace had a skillet of hash browns ready and nowhere to set the plate. The burners were free and the ingredients were on the counter. Every cook was ready to work, and every cook stood still.
At table 9 someone grumbled that the kitchen was slow tonight. Casey checked the stopwatch, looked at the full pass, and wrote: Plates ready in 3. Quinn picked up in 12.
What ASYNC_NETWORK_IO Means
That’s what SQL Server does when the application doesn’t read results as fast as SQL Server sends them. The query finds its rows and packs them into network packets for the client. When the client stops reading, the packets back up. SQL Server can’t send more, so the request waits with ASYNC_NETWORK_IO until the client catches up.
The name points at the network, and that sends people the wrong way. In my health checks, the network turns out to be the cause in a small share of cases. Here’s how I rank the causes, most common first.
- The app processes each row while the result set is open. It reads one row, calls a web service or writes to a file, then reads the next row. That’s Quinn telling the story between plates.
- The app asks for far more rows than it needs. It pulls a whole table and then filters or pages on the client side.
- The client machine is short on CPU or memory, so it reads slowly.
- The network is slow or far away, such as a VPN or a long link between data centers.
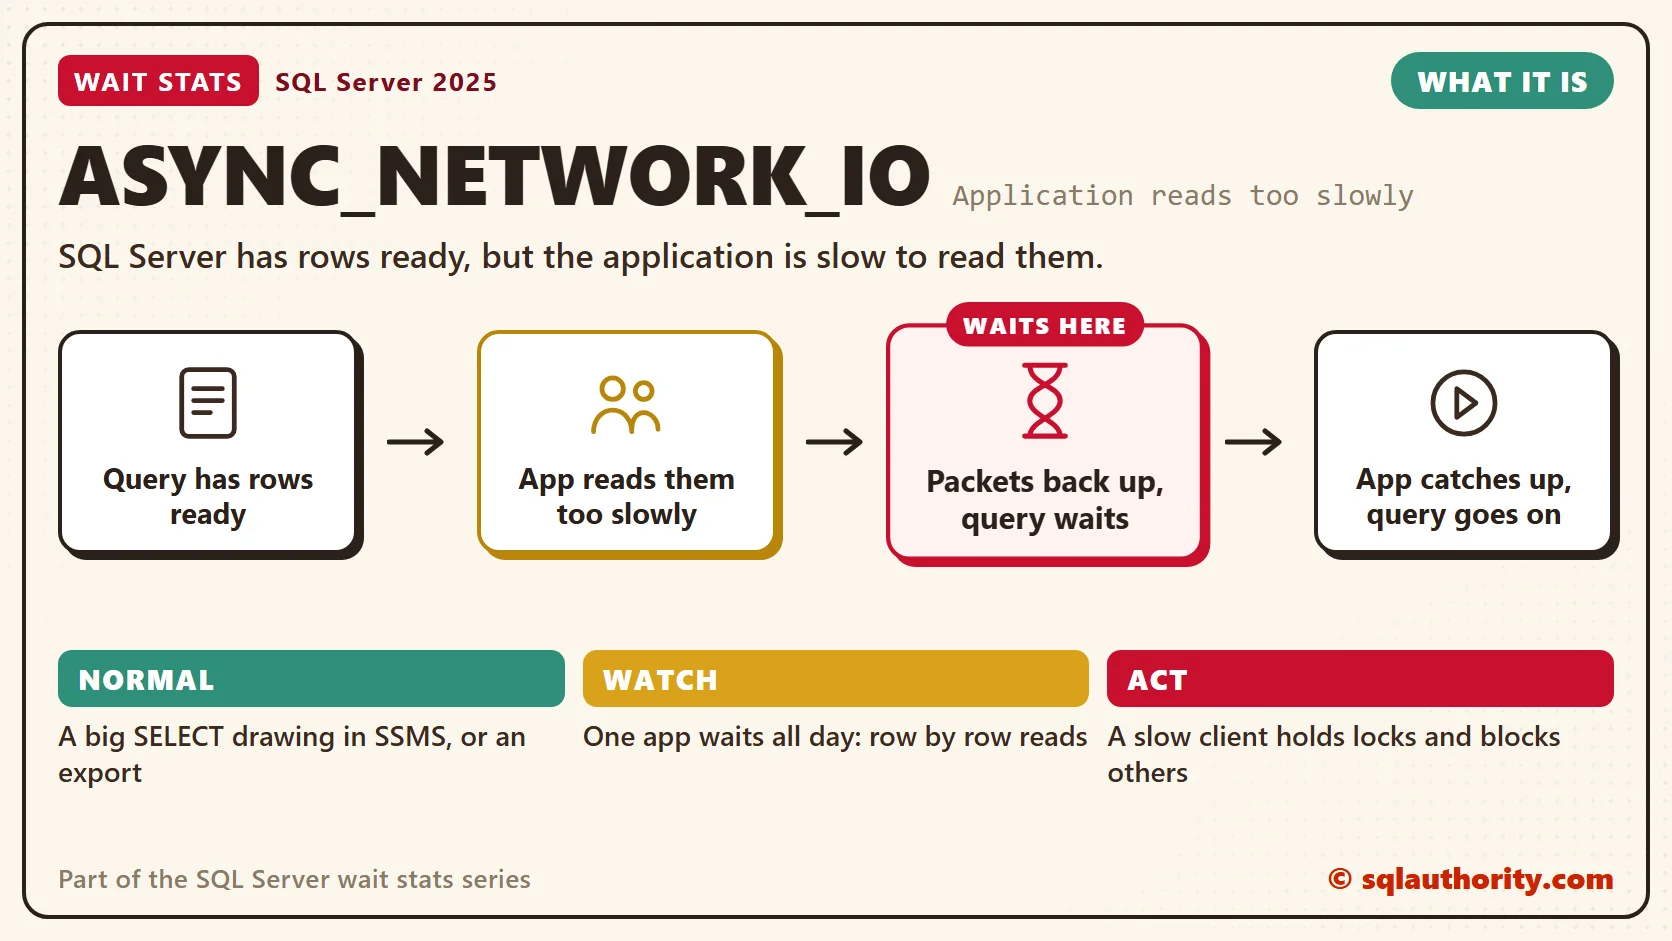
While it waits, the request stays open. It keeps its worker thread, and inside a transaction it keeps its locks too. That’s how a slow report on one desk ends up blocking an update somewhere else.
Normal or a Problem?
| Situation | What it means | What to do |
|---|---|---|
| Someone ran a big SELECT in SSMS and the grid is drawing a million rows | The tool is slow to display rows. | Normal. Ask for fewer rows, or use “Discard results after execution” for timing tests. |
| A nightly export or ETL tool shows this wait | The tool writes each row somewhere as it reads. | Fine if it ends on time. |
| One app shows long ASYNC_NETWORK_IO all day | It reads row by row, or it pulls too many rows. | Take the program name and the query to the app team. |
| A session in ASYNC_NETWORK_IO is a head blocker | An open transaction is waiting on a slow client. | Urgent. Fix how that app reads results. |
See It on Your Server
The first query shows which machine and which program are making SQL Server wait right now. It joins the request to its session, because the session holds the client details.
-- Who is slow to read results right now
SELECT r.session_id,
       r.wait_time AS wait_ms,
       r.open_transaction_count,
       s.host_name,
       s.program_name,
       s.login_name,
       t.text AS batch_text
FROM sys.dm_exec_requests AS r
JOIN sys.dm_exec_sessions AS s
    ON s.session_id = r.session_id
CROSS APPLY sys.dm_exec_sql_text(r.sql_handle) AS t
WHERE r.wait_type = N'ASYNC_NETWORK_IO';
Run it a few times during the slow hour. The same host_name and program_name again and again is your Quinn. Both values come from the client’s connection string, so they’re only as good as the app makes them. Any row with open_transaction_count above zero goes to the top of your list.
The second query adds up this wait per program, using the waits each session has collected so far.
-- ASYNC_NETWORK_IO per program, from current sessions
SELECT s.program_name,
       s.host_name,
       SUM(w.waiting_tasks_count) AS waits,
       SUM(w.wait_time_ms) AS wait_ms
FROM sys.dm_exec_session_wait_stats AS w
JOIN sys.dm_exec_sessions AS s
    ON s.session_id = w.session_id
WHERE w.wait_type = N'ASYNC_NETWORK_IO'
GROUP BY s.program_name, s.host_name
ORDER BY wait_ms DESC;
The view sys.dm_exec_session_wait_stats keeps waits per session (SQL Server 2016 and later). With connection pooling, the numbers reset when a pooled connection is reused. Treat the result as a sample of who is slow today, not a full history.
Talking to the App Team
You could say the DBA can’t change the application, so why chase this wait? Fair point, the code isn’t yours. But you can hand the app team three facts: the program, the query and the time spent waiting. That turns “the database is slow” into a conversation that goes somewhere.
The opposite mistake is common too. Teams ask for a faster network link to fix a slow report. The link gets faster and the report doesn’t. The real delay sits in the report tool, which formats each row before it asks for the next one.
Fix It
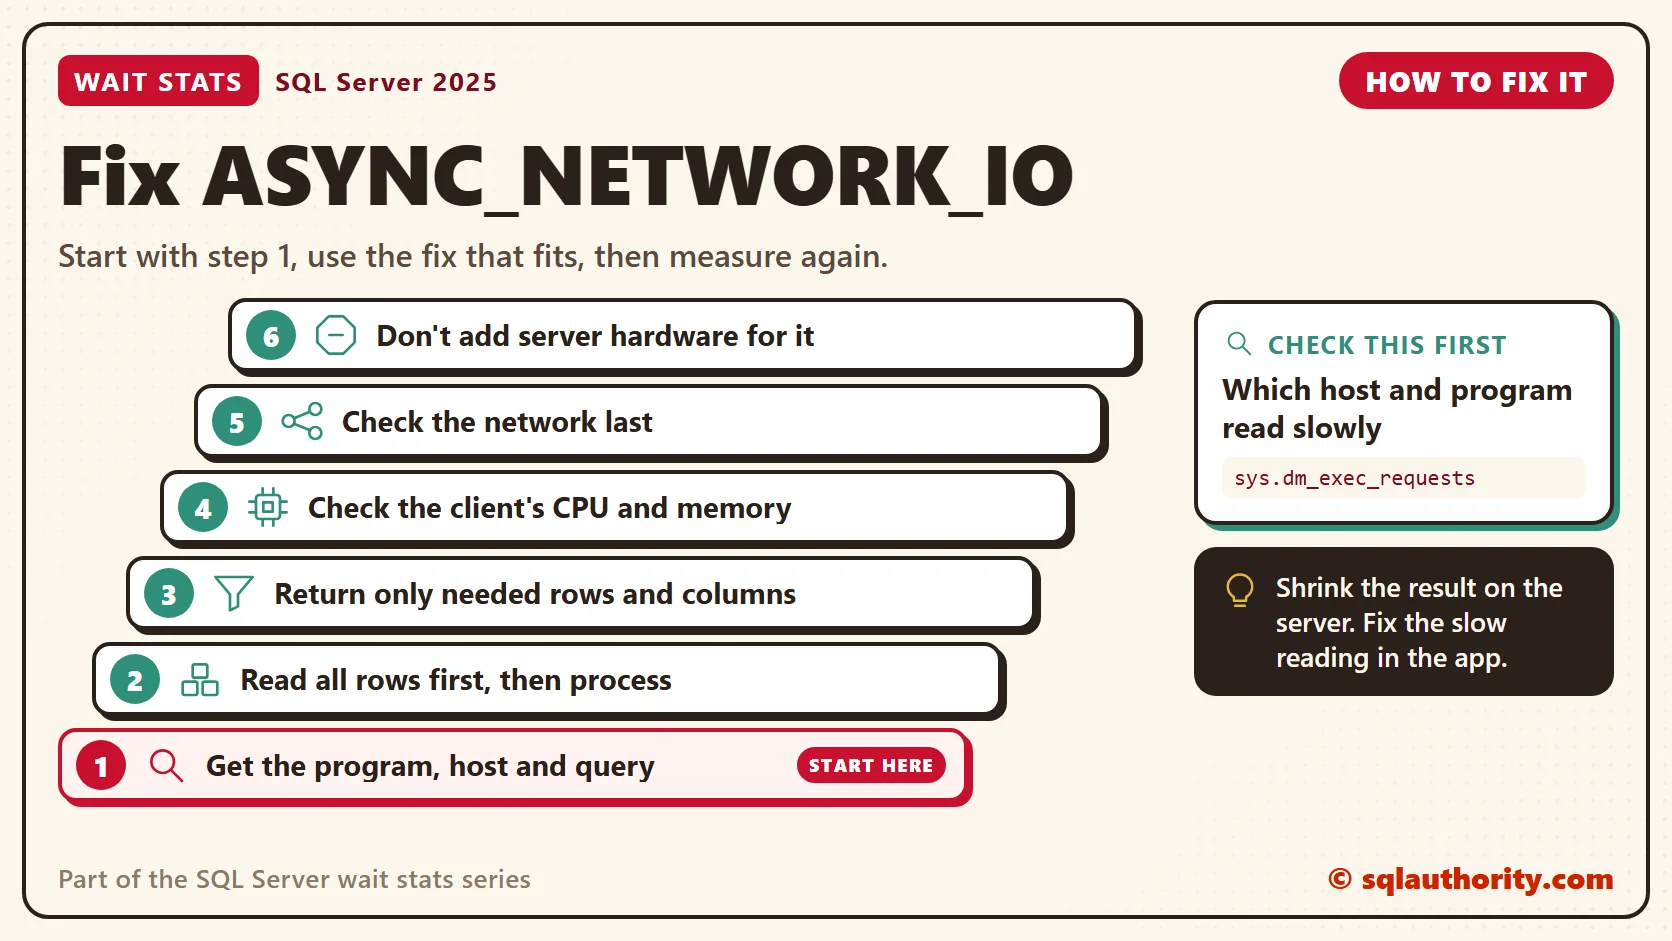
- Confirm this wait leads during the slow time, and get the program, host and query from the first query.
- Read all the rows first, then process them. Better still, do the per-row work in SQL as one set-based statement.
- Return only the rows and columns the screen needs. Filter on the server with WHERE, and page with OFFSET and FETCH or a key range.
- Check the client machine’s CPU and memory while it reads.
- Check the network last: latency between the app and the database server, and clients on VPN or Wi-Fi.
- Don’t add server CPU or memory for this wait. Faster hardware won’t make the client read faster. Server-side tuning helps only when it shrinks the result, as in step 3.
New in SQL Server 2022 and 2025
Nothing in SQL Server 2022 or 2025 changes what ASYNC_NETWORK_IO means, and the fix still lives in the application. One thing helps you find it. Query Store is on by default for new databases since SQL Server 2022. Its Network IO wait category shows which queries spent time waiting on clients.
Related Reading
- Is It the Database? Reading ASYNC_NETWORK_IO
- Query Store Wait Stats: Why a Query Was Slow, Not Just That It Was
The Clipboard Diner, a wait stats series. Previous: MSQL_XP Wait Stats: Extended Procedures and External Code. Next: HADR_SYNC_COMMIT Wait Stats: Availability Group Commits. Every post is listed in the series guide.
After that, Casey opens a sister diner across town, and every sale needs a phone call.
ASYNC_NETWORK_IO is not a slow database, it is a full pass waiting for someone to pick up the plates.
Published by Pinal Dave on SQLAuthority. More of my work at pinaldave.com.
Discover more from SQL Authority with Pinal Dave
Subscribe to get the latest posts sent to your email.




3 Comments. Leave new
Good article! I read half of it and thought that I digest it first before going ahead with the other half.
I’ll just have one thing to add. ASYNC_NETWORK_IO is normal wait state if the process is not running anymore. You need to check cmd column in sys.sysprocesses view. If it says AWAITING COMMAND then everything’s OK. But if it says SELECT the process has ended the query but is still sending data. This tells that you have performance issues with the network or with the receiving end.
In fact, if you run the query SELECT * FROM sys.sysprocesses; you’ll see that there’s always one process in the state ASYNC_NETWORK_IO/SELECT and that’s your own query :)
Pinal, I don’t think I’m going to write the article I was talking about in the email. This Feodor’s post covers everything I was going to write and I really don’t have much to add.
-Marko
Marko, please do not give up your blog post. I know you are one of the brightest DBAs in the Nordics and I am sure you have plenty more to say on the subject.
(Well, if you do not feel like giving your blog post to Pinal, give it to me and I will post it on my blog :) )
I have used begin transaction in stored procedure that sp used about 1500 To 2000 times in one day for insert the record in 4 tables and fired the some triggers on two tables then updates the 3 to 4 tables records.some time my transaction come in sleeping mode. then i kill the transaction then insert the record.Plz tell the sol.