Per-second counters in SQL Server are often running totals, not rates. Batch Requests/sec in the DMV is a total since startup. To get a real rate, take two timestamped samples and divide the difference by the seconds that actually passed.
Why the dashboard number looks wrong
A junior DBA builds a chart from sys.dm_os_performance_counters. The line says Batch Requests/sec is in the tens of thousands, on a server that is nearly asleep. The name says “per second”, so the chart says “per second”. The number is a total since the last restart, and it only ever goes up.
The column that tells you which kind of counter you are looking at is cntr_type. The query below reads three counters. The one called Batch Requests/sec has type 272696576, which means a running total that needs two samples. The hit ratio and its base are a different kind of pair.
SELECT object_name, counter_name, instance_name, cntr_type, cntr_value
FROM sys.dm_os_performance_counters
WHERE RTRIM(counter_name) IN (N'Batch Requests/sec', N'Buffer cache hit ratio', N'Buffer cache hit ratio base')
ORDER BY object_name, counter_name;
Look at the cntr_type column first, then the value. Never put a raw cntr_value on a chart before you know its type.
Take two samples
Store each sample with its collection time and the SQL Server start time. The start time lets you spot a restart even when a counter looks normal. The first block creates a temp table and takes sample one. A real collector would run on a schedule and write to a monitoring database.
DROP TABLE IF EXISTS #CounterSample;

CREATE TABLE #CounterSample
(SampleId bigint IDENTITY PRIMARY KEY, CollectedAt datetime2 NOT NULL,
 ServerStartTime datetime2 NOT NULL, ObjectName nvarchar(128),
 CounterName nvarchar(128), InstanceName nvarchar(128),
 CounterType int, CounterValue bigint);

INSERT #CounterSample
(CollectedAt, ServerStartTime, ObjectName, CounterName, InstanceName, CounterType, CounterValue)
SELECT SYSUTCDATETIME(), i.sqlserver_start_time, p.object_name, p.counter_name,
       p.instance_name, p.cntr_type, p.cntr_value
FROM sys.dm_os_performance_counters AS p
CROSS JOIN sys.dm_os_sys_info AS i
WHERE RTRIM(p.counter_name) = N'Batch Requests/sec';
A quiet test server does almost nothing, so I create some work. The batch below does nothing useful, and GO 50 sends it fifty times. Each send counts as one batch request. Then I wait two seconds and take sample two.
DECLARE @Nothing int = 1;
GO 50
WAITFOR DELAY '00:00:02';
GO
INSERT #CounterSample
(CollectedAt, ServerStartTime, ObjectName, CounterName, InstanceName, CounterType, CounterValue)
SELECT SYSUTCDATETIME(), i.sqlserver_start_time, p.object_name, p.counter_name,
       p.instance_name, p.cntr_type, p.cntr_value
FROM sys.dm_os_performance_counters AS p
CROSS JOIN sys.dm_os_sys_info AS i
WHERE RTRIM(p.counter_name) = N'Batch Requests/sec';
Now look at the raw samples. This is the proof that the counter is cumulative.
SELECT CollectedAt, CounterName, CounterValue
FROM #CounterSample
ORDER BY CollectedAt, SampleId;
There are two rows, and the second value is larger than the first by at least the fifty batches I sent. Neither number is a rate. The difference between them is the work done in between.
Divide by the seconds that really passed
Do not assume WAITFOR waited exactly two seconds. Use the two timestamps. LAG pulls the previous sample for the same counter, and the measured milliseconds divided by 1000 give the denominator. The WHERE clause rejects a pair that crosses a restart or a counter that went down.
WITH P AS
(SELECT *,
        LAG(CounterValue) OVER (PARTITION BY ObjectName, CounterName, InstanceName ORDER BY CollectedAt, SampleId) AS PreviousValue,
        LAG(CollectedAt) OVER (PARTITION BY ObjectName, CounterName, InstanceName ORDER BY CollectedAt, SampleId) AS PreviousAt,
        LAG(ServerStartTime) OVER (PARTITION BY ObjectName, CounterName, InstanceName ORDER BY CollectedAt, SampleId) AS PreviousStart
 FROM #CounterSample
 WHERE CounterType = 272696576)
SELECT CollectedAt, CounterName, InstanceName,
       (CounterValue - PreviousValue) * 1000.0
         / NULLIF(DATEDIFF_BIG(millisecond, PreviousAt, CollectedAt), 0) AS RequestsPerSecond
FROM P
WHERE PreviousAt IS NOT NULL AND ServerStartTime = PreviousStart
  AND CounterValue >= PreviousValue AND CollectedAt > PreviousAt
ORDER BY CollectedAt, SampleId;
One row comes back, and it is a small number next to the raw total. That is the real request rate over those two seconds, and it includes my fifty batches. Your server will show a different value, and it will change every time you run this.

Ratio counters need their base
Buffer cache hit ratio is a different animal. It is a fraction, and it only makes sense next to its base counter. Pair them by object and instance, divide, and multiply by 100. This one is a snapshot, so it needs no second sample.
SELECT n.object_name, n.instance_name, n.cntr_type, b.cntr_type AS BaseType,
       100.0 * n.cntr_value / NULLIF(b.cntr_value, 0) AS BufferCacheHitPercent
FROM sys.dm_os_performance_counters AS n
JOIN sys.dm_os_performance_counters AS b
  ON b.object_name = n.object_name AND b.instance_name = n.instance_name
 AND RTRIM(b.counter_name) = N'Buffer cache hit ratio base'
WHERE RTRIM(n.counter_name) = N'Buffer cache hit ratio' AND n.cntr_type = 537003264;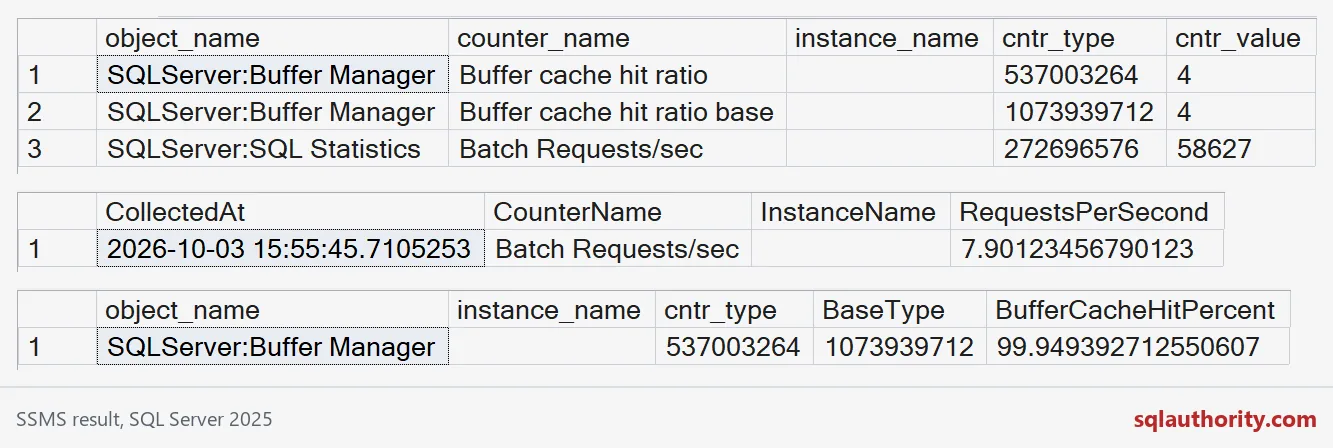
The screenshot above was taken in pieces. That is why the first grid shows 4 and 4, while the percentage in the last grid is a little under 100. These counters move all the time. Also, on a named instance the object names start with MSSQL$ and the instance name, not with SQLServer:.
Gaps, restarts and cadence
A long gap between samples gives you an average over the gap, not the peak inside it. Store the elapsed seconds beside every rate, and do not fill missing samples with invented numbers. Check for decreases too, because some counters reset for reasons other than a restart.
Short intervals show brief changes but create more rows. Pick the cadence for the decision you need to make. Run the collector as a scheduled job, not as a window that waits forever. The last block removes the temp table.
DROP TABLE IF EXISTS #CounterSample;Next time a chart says “per second”, ask for two samples.
A cumulative counter is not a rate, it is a total waiting for a second sample.
Published by Pinal Dave on SQLAuthority. More of my work at pinaldave.com.
Discover more from SQL Authority with Pinal Dave
Subscribe to get the latest posts sent to your email.