
Cached data per object tells you which tables and indexes fill the buffer pool. SQL Server keeps recently used pages in memory, and one view lists every one of them. A short query turns that list into megabytes for each index.

What the Buffer Pool View Holds
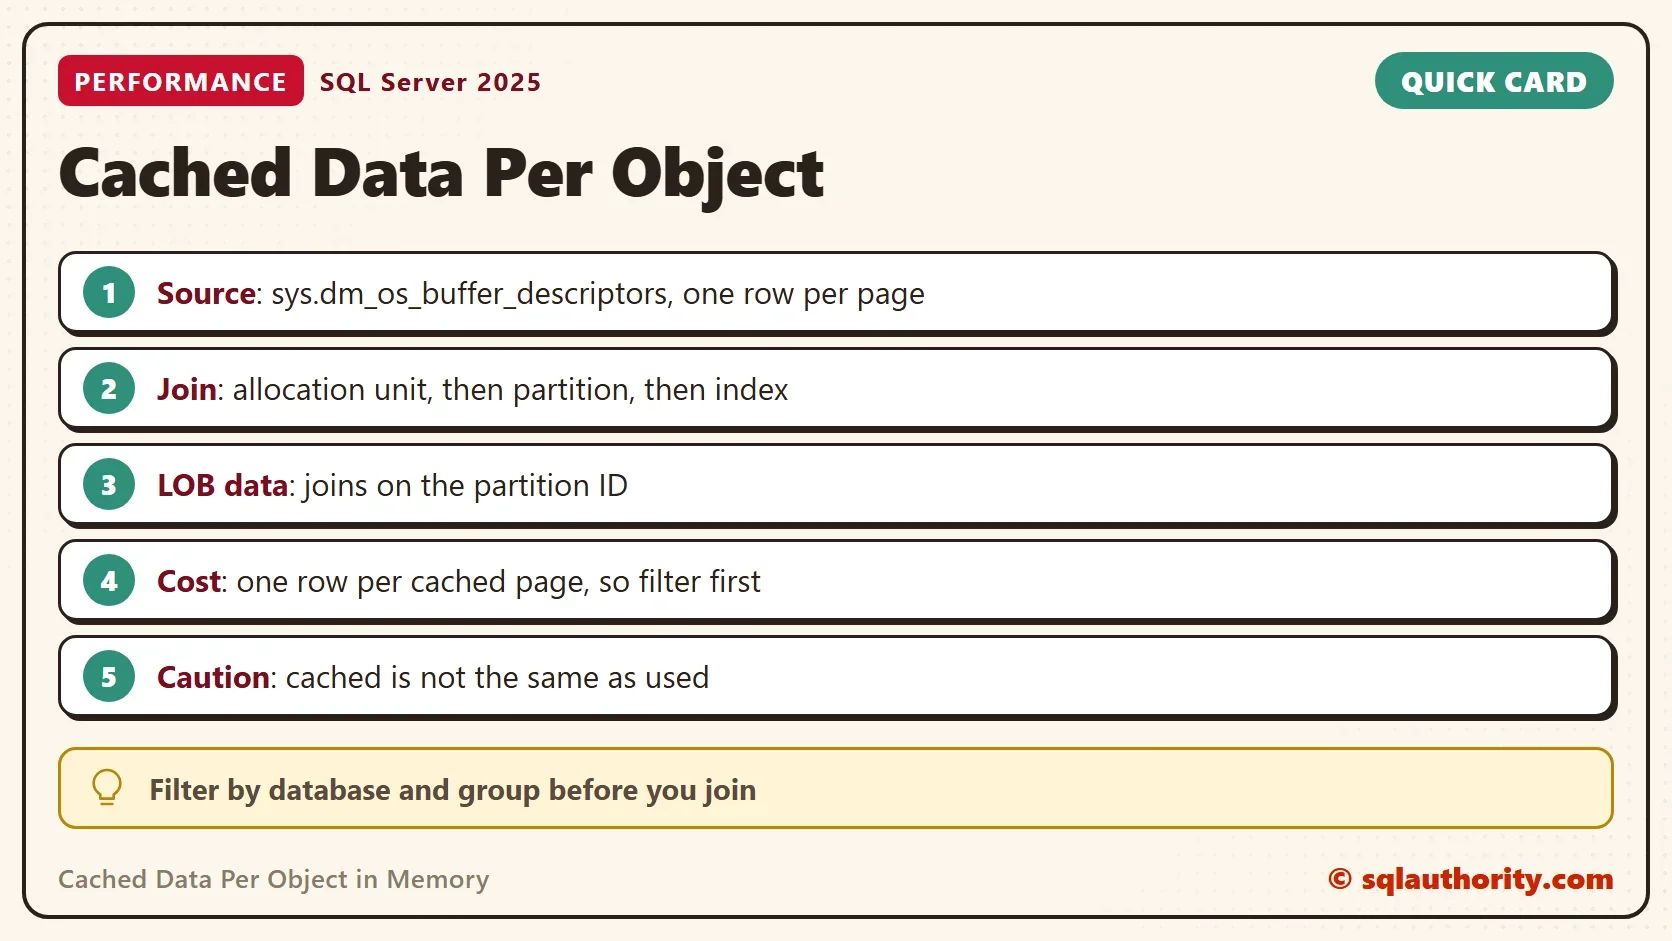
The view sys.dm_os_buffer_descriptors has one row for each 8 KB page in memory. A row carries the database ID, the allocation unit ID and a flag for changed pages. It does not carry an object name. To find the table, the query follows a chain. It goes from the allocation unit to the partition and then to the index. Reading the view needs VIEW SERVER STATE, which is VIEW SERVER PERFORMANCE STATE on SQL Server 2022 and later.
The join has one wrinkle. Normal row data and overflow data link to a partition through the HoBT ID. Large object data links through the partition ID instead. The query below handles both with one condition. This post reports each index and handles large object data. The post Memory Used by Each Table in the SQL Server Buffer Pool adds up whole tables.
Build Two Tables and Empty Their Cache
The demo database CachedObjectDemo holds a customer table of 50,000 rows and an order table of 200,000 rows. The order table has a second index on the order date. Freshly loaded pages sit in memory, so the next script takes only this database offline and brings it back. That clears its pages from the buffer pool and touches no other database. If the second statement fails, run it by hand, because the database stays offline until then.
IF DB_ID(N'CachedObjectDemo') IS NULL CREATE DATABASE CachedObjectDemo;
GO
USE CachedObjectDemo;
GO
DROP TABLE IF EXISTS dbo.OrderHeader;
DROP TABLE IF EXISTS dbo.Customer;
CREATE TABLE dbo.Customer (CustomerID int NOT NULL CONSTRAINT PK_Customer PRIMARY KEY, FullName nvarchar(60) NOT NULL, City nvarchar(40) NOT NULL, Notes char(200) NOT NULL DEFAULT 'x');
CREATE TABLE dbo.OrderHeader (OrderID int NOT NULL CONSTRAINT PK_OrderHeader PRIMARY KEY, CustomerID int NOT NULL, OrderDate date NOT NULL, Amount decimal(10,2) NOT NULL, Filler char(100) NOT NULL DEFAULT 'y');
WITH n AS (SELECT TOP (200000) ROW_NUMBER() OVER (ORDER BY (SELECT NULL)) AS i FROM sys.all_columns AS a CROSS JOIN sys.all_columns AS b)
INSERT INTO dbo.Customer (CustomerID, FullName, City)
SELECT i, CONCAT(N'Customer ', i), CHOOSE(i % 4 + 1, N'Austin', N'Denver', N'Portland', N'Boston') FROM n WHERE i <= 50000;
WITH n AS (SELECT TOP (200000) ROW_NUMBER() OVER (ORDER BY (SELECT NULL)) AS i FROM sys.all_columns AS a CROSS JOIN sys.all_columns AS b)
INSERT INTO dbo.OrderHeader (OrderID, CustomerID, OrderDate, Amount)
SELECT i, i % 50000 + 1, DATEADD(DAY, i % 365, '2026-01-01'), (i % 500) + 0.25 FROM n;
CREATE INDEX IX_OrderHeader_Date ON dbo.OrderHeader (OrderDate);
USE master;
GO
ALTER DATABASE CachedObjectDemo SET OFFLINE WITH ROLLBACK IMMEDIATE;
ALTER DATABASE CachedObjectDemo SET ONLINE;
GO
USE CachedObjectDemo;
GO
SELECT COUNT(*) AS PagesInMemory FROM sys.dm_os_buffer_descriptors WHERE database_id = DB_ID();
The count is small, 215 on the test server, and it varies. The two tables have not been read yet.
Now read part of the data. The first query scans the whole order table through its clustered index. The second reads 101 customers by range seek on the key and touches only a few pages.
SELECT SUM(Amount) AS TotalAmount FROM dbo.OrderHeader;
SELECT COUNT(*) AS CustomersRead FROM dbo.Customer WHERE CustomerID BETWEEN 100 AND 200;
List Cached Data Per Object
The query for cached data per object counts pages per allocation unit first, and only for the current database. That keeps the join small, because it joins a handful of groups instead of every page. Then it starts from the allocation units of every index and joins the cached counts to them. An index with pages missing from memory still counts all its pages in the share. The query adds each index together and shows megabytes and the share in memory.
WITH cached AS (
    SELECT allocation_unit_id, COUNT_BIG(*) AS CachedPages
    FROM sys.dm_os_buffer_descriptors
    WHERE database_id = DB_ID()
    GROUP BY allocation_unit_id
)
SELECT OBJECT_NAME(p.object_id) AS ObjectName, i.name AS IndexName, i.type_desc AS IndexType,
       SUM(ISNULL(c.CachedPages, 0)) AS CachedPages,
       CONVERT(decimal(9,2), SUM(ISNULL(c.CachedPages, 0)) * 8 / 1024.0) AS CachedMB,
       CONVERT(decimal(5,1), 100.0 * SUM(ISNULL(c.CachedPages, 0)) / NULLIF(SUM(au.total_pages), 0)) AS PercentOfIndexCached
FROM sys.allocation_units AS au
INNER JOIN sys.partitions AS p ON (au.type IN (1, 3) AND au.container_id = p.hobt_id)
                               OR (au.type = 2 AND au.container_id = p.partition_id)
INNER JOIN sys.indexes AS i ON i.object_id = p.object_id AND i.index_id = p.index_id
LEFT JOIN cached AS c ON c.allocation_unit_id = au.allocation_unit_id
WHERE OBJECTPROPERTY(p.object_id, 'IsUserTable') = 1
GROUP BY p.object_id, i.name, i.type_desc
ORDER BY CachedPages DESC;| ObjectName | IndexName | IndexType | CachedPages | CachedMB | PercentOfIndexCached |
|---|---|---|---|---|---|
| OrderHeader | PK_OrderHeader | CLUSTERED | 3251 | 25.40 | 99.6 |
| Customer | PK_Customer | CLUSTERED | 54 | 0.42 | 3.3 |
| OrderHeader | IX_OrderHeader_Date | NONCLUSTERED | 1 | 0.01 | 0.3 |
The table above comes from one run on my test server, and the page counts move a little between runs. A second server showed 40 pages for the customer index instead of 54. The clustered index of the order table holds nearly all of its pages in memory, because the scan read them. The customer table has a small share, because the range seek touched few pages. The date index shows 0 or 1 pages, because no query used it.
Each index counts as an object of its own. A query can use a nonclustered index instead of the table. The index name in the result tells you which structure was read. The script gets the name from sys.indexes.
Why This Query Needs Care on a Big Server
The view has a row for every cached page. On the test server it held 199,384 rows when the demo ran. A buffer pool of 1 TB holds about 134 million pages, so the view returns about 134 million rows. On a production server with a lot of memory, the query takes a long time.
Three habits keep the cost of reading cached data per object down. Filter on database_id before anything else. Group by allocation unit before you join, as the script does. Run the query once, outside the busiest hour. Keep the result in a table if you need it again.
Cached Is Not the Same as Used
You could argue that a large cached table is a problem. It is not by itself. Memory exists to hold the pages that queries read. The question is whether the right objects are there. A scan from a nightly job can fill the pool with an index nobody needs the rest of the day. The result shows what sits in memory, not what earns its place.
For the second question, use Unused Index Script: Find Indexes That Only Cost You Writes. For the count of changed pages, read Dirty Pages and Clean Pages in the SQL Server Buffer Pool. For the cached pages of one table, read Buffer Pool Pages for One Table in SQL Server. For one total per table, read Memory Used by Each Table in the SQL Server Buffer Pool.
What to Remember
Cached data per object comes from three joins: the buffer descriptors, the allocation units and the partitions. Filter by database first, group early, and read the percent of each index that is in memory. A high number means a structure that queries read. A low number means little reading. Run the cleanup script when you finish.
USE master;
GO
IF DB_ID(N'CachedObjectDemo') IS NOT NULL
BEGIN
    ALTER DATABASE CachedObjectDemo SET SINGLE_USER WITH ROLLBACK IMMEDIATE;
    DROP DATABASE CachedObjectDemo;
END;
Memory is not full of waste, it is full of what your queries asked for.
Published by Pinal Dave on SQLAuthority. More of my work at pinaldave.com.
Discover more from SQL Authority with Pinal Dave
Subscribe to get the latest posts sent to your email.




2 Comments. Leave new
Hey Pinal! It’s been too long!
So what happens when you run this on a production server with lots of RAM? ;-)
… it takes forever to return the data!