The User Statistics report in SSMS lists the users who are connected to a database. One user with many sessions stands out at once. A short query gives the same answer when you cannot click through the menus.

A Client With Too Many Sessions
During a performance engagement, a client had many active sessions from different users. After a few queries, one user turned out to hold many sessions that had nothing to do with the system. The team isolated that user. The performance came back to its usual level.
The report that shows this is part of SSMS. It needs no script. It is also the quickest way to answer the first question of such a case: who is connected right now?
Open the Report
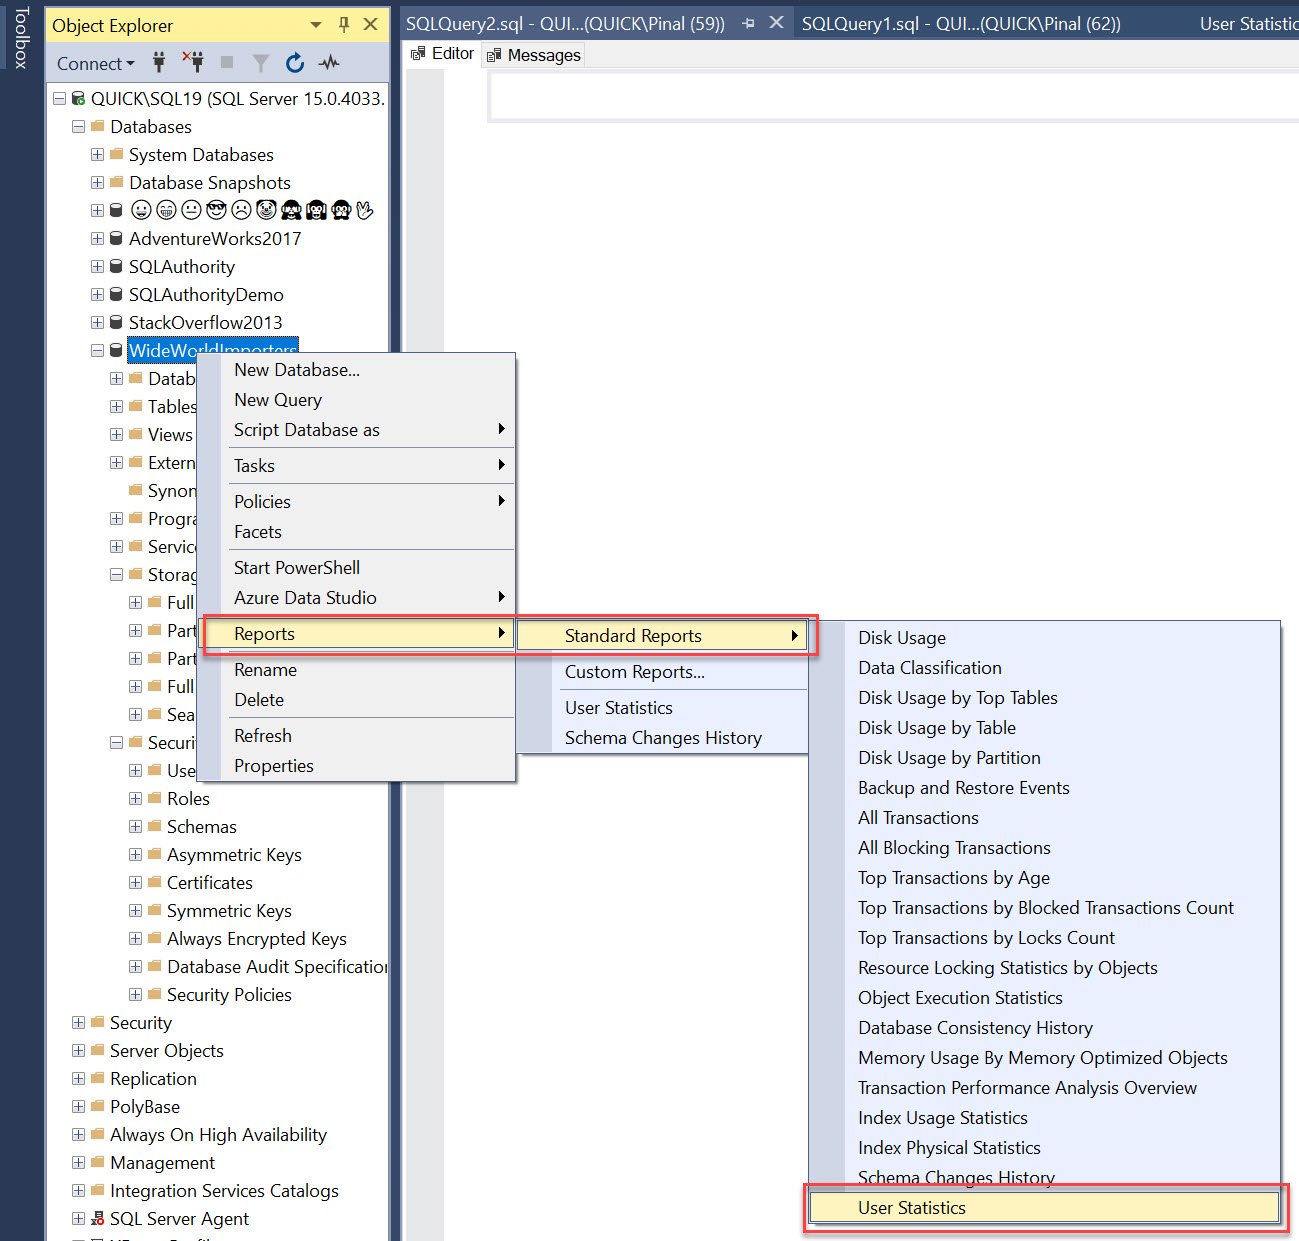
The report belongs to a database. In Object Explorer, right-click the database. Then choose Reports, Standard Reports and User Statistics. The User Statistics report lists the users who are currently connected to that database, with their activity. The report lists each login with its sessions, open transactions, cursors, CPU time, reads and writes. Open it from the database you want to check, not from the server. Open it twice, a few minutes apart. A user whose count only grows is the one to ask about.
In my opinion the default reports are heavy. They are fine for one quick look at one database. For anything repeated, a query is lighter.
The Same Question in T-SQL
A query over sys.dm_exec_sessions answers it. The view has one row for each session. The filter keeps user sessions that use the current database. The query groups them by login and application. It counts the sessions and the ones that sit idle. The demo creates an empty database named SessionReportDemo so that your own window has something to connect to.
IF DB_ID(N'SessionReportDemo') IS NULL CREATE DATABASE SessionReportDemo;
GO
USE SessionReportDemo;
GO
SELECT s.login_name AS LoginName, s.program_name AS Application, COUNT(*) AS Sessions,
       SUM(CASE WHEN s.status = N'sleeping' THEN 1 ELSE 0 END) AS Sleeping,
       SUM(s.cpu_time) AS CpuMs, SUM(s.reads) AS Reads
FROM sys.dm_exec_sessions AS s
WHERE s.database_id = DB_ID() AND s.is_user_process = 1
GROUP BY s.login_name, s.program_name
ORDER BY Sessions DESC, Application;
Add s.host_name to the GROUP BY to see which machine holds the sessions. Without the VIEW SERVER STATE permission, a login sees only its own session. On SQL Server 2022 and later the permission is VIEW SERVER PERFORMANCE STATE.
On one connection the result has one row, your own session. To see the problem, open more connections. The PowerShell script below opens three, two from an application named ReportApp and one from ImportJob. It holds them for a minute and then closes them. Run the query from your window while they are open. Change the instance name to yours. The script does not touch any table.
$names = 'ReportApp', 'ReportApp', 'ImportJob'
$connections = foreach ($name in $names) {
    $c = New-Object System.Data.SqlClient.SqlConnection ("Server=.\SQLDEV;Database=SessionReportDemo;Integrated Security=True;TrustServerCertificate=True;Application Name=" + $name)
    $c.Open()
    $c
}
Start-Sleep -Seconds 60
$connections | ForEach-Object { $_.Close() }| Application | Sessions | Sleeping |
|---|---|---|
| ReportApp | 2 | 2 |
| ImportJob | 1 | 1 |
| SQLCMD | 1 | 0 |
The table comes from that test. Every row had the same Windows login, so the table leaves the login out. ReportApp holds two sessions and ImportJob holds one. Both are asleep, which means they are connected and doing nothing. The last row is the query window itself. SSMS shows its own application name there, and it is longer.
Find the User Who Holds the Sessions
One application with a high count is the lead. A count of two proves nothing. A count in the hundreds is a different matter. A sleeping session costs memory and holds locks if it has an open transaction. The Sleeping column shows how many do nothing, and the next query lists them one by one. It adds the host and the open transaction count, which is what you read before you decide anything.
SELECT s.session_id, s.login_name, s.host_name, s.program_name, s.status, s.open_transaction_count
FROM sys.dm_exec_sessions AS s
WHERE s.database_id = DB_ID() AND s.is_user_process = 1 AND s.session_id <> @@SPID
ORDER BY s.program_name, s.session_id;
Run it while the connections are open and you get one row for each. A session with open_transaction_count above 0 is the one that blocks others. KILL ends a session, but check with the owner first. A killed session rolls back its work.
Which One Should You Use?
You could argue that the report is easier. It is, for someone who does not write queries. The User Statistics report needs no code. The query wins when you want to filter, save the result, or run it from a job. It also shows the application name, which tells you which program to blame. The report covers one database at a time. The query reads every database at once when you drop the database filter.
What to Remember
Open the User Statistics report from the database you want to check. Use the query when you need to group, filter or repeat the check. Read the sleeping sessions and the open transactions before you end anything.
When you finish the demo, remove the database.
USE master;
GO
IF DB_ID(N'SessionReportDemo') IS NOT NULL
BEGIN
    ALTER DATABASE SessionReportDemo SET SINGLE_USER WITH ROLLBACK IMMEDIATE;
    DROP DATABASE SessionReportDemo;
END;
A connection is not a person, it is a seat that somebody forgot to leave.
Published by Pinal Dave on SQLAuthority. More of my work at pinaldave.com.
Discover more from SQL Authority with Pinal Dave
Subscribe to get the latest posts sent to your email.