
To get STATISTICS TIME and IO for every query, tick two boxes in the SSMS options once. Then you never type SET STATISTICS again, and every query reports its cost.

What the Two Settings Report
SET STATISTICS IO counts the pages a query reads, one line for each table. SET STATISTICS TIME reports the time that compiling and running the query took. Both print their lines in the Messages tab, below the results. I read them before I open an execution plan. Two numbers on a line are easier to compare than a picture.
The demo builds a table of 50,000 orders in a database named StatsTimeIoDemo. A formula fills it, so every run builds the same rows. Run the script on a test server.
IF DB_ID(N'StatsTimeIoDemo') IS NULL CREATE DATABASE StatsTimeIoDemo;
GO
USE StatsTimeIoDemo;
GO
DROP TABLE IF EXISTS dbo.Orders;
CREATE TABLE dbo.Orders (
    OrderID    int           NOT NULL PRIMARY KEY,
    CustomerID int           NOT NULL,
    Status     varchar(10)   NOT NULL,
    Total      decimal(10,2) NOT NULL,
    Note       char(60)      NOT NULL
);
INSERT INTO dbo.Orders (OrderID, CustomerID, Status, Total, Note)
SELECT n, 1 + (n % 500), 'Open', 10 + (n % 90), 'x'
FROM (SELECT TOP (50000) ROW_NUMBER() OVER (ORDER BY (SELECT NULL)) AS n
      FROM sys.all_objects AS a CROSS JOIN sys.all_objects AS b) AS x;
Type the two settings once for this window. The query asks for the order count and revenue of one customer. The table has no index on CustomerID, so SQL Server must read every page.
SET STATISTICS IO, TIME ON;
GO
SELECT COUNT(*) AS Orders, SUM(Total) AS Revenue
FROM dbo.Orders
WHERE CustomerID = 17;
The Messages tab shows lines like the two below. The first has the number to watch, and your times will differ.
Table 'Orders'. Scan count 1, logical reads 584, physical reads 0, page server reads 0, read-ahead reads 0, page server read-ahead reads 0, lob logical reads 0, lob physical reads 0, lob page server reads 0, lob read-ahead reads 0, lob page server read-ahead reads 0.
SQL Server Execution Times:
   CPU time = 0 ms,  elapsed time = 3 ms.
Scan count 1 means one scan of the table. Logical reads 584 means 584 pages, each read from memory. Physical reads and read-ahead reads count pages that came from disk. They are 0 here because the pages were cached.
The CPU and elapsed times are in milliseconds. They change on every run, so compare the logical reads first. A third line, the parse and compile time, is the cost of building the plan. It shows up for a new query text and drops to 0 when the plan is reused.
The reads are the same on every run, as long as the data and the plan stay the same. The first run after a restart can show physical reads, because the pages are not cached yet. Run the query twice and compare the second run.
Turn Them On for Every Window
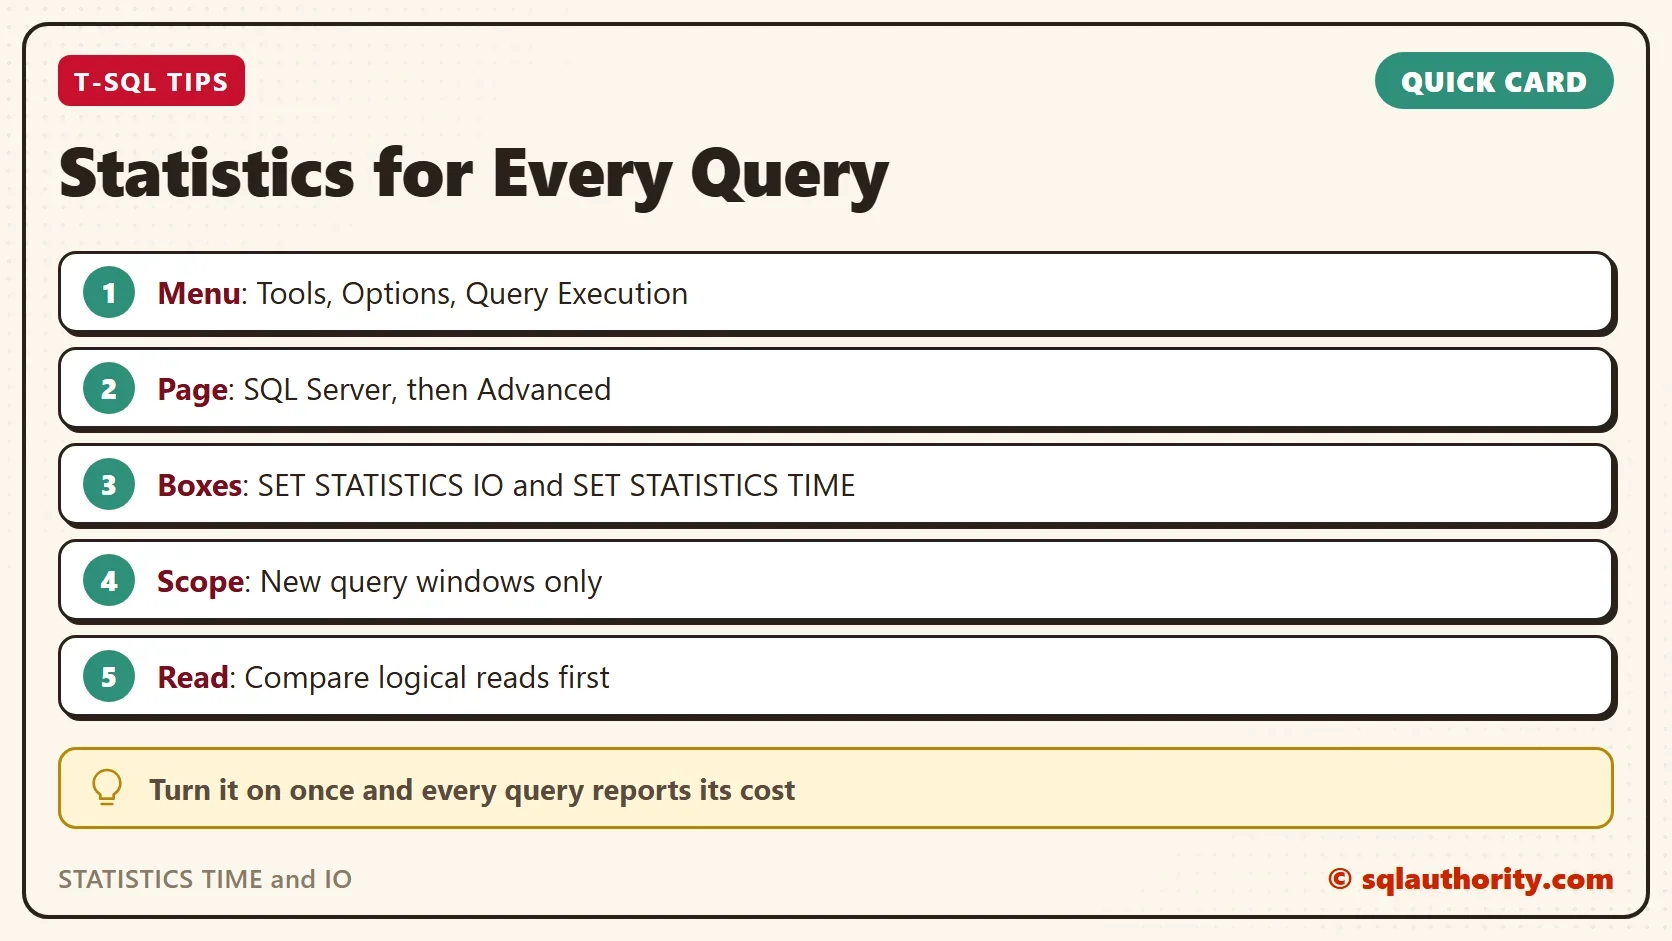
Typing the SET line in each window is easy to forget. In SSMS 22, open Tools, then Options, then Query Execution, then SQL Server, then Advanced. Tick SET STATISTICS TIME and SET STATISTICS IO. The setting applies to query windows you open afterward. A window that is already open keeps its old setting, so open a new one. To change only the current window, use the Query Options dialog on the Query menu.
Use the Numbers to Test a Change
Now add an index that covers the query. The INCLUDE column carries the Total, so the query never touches the table itself. Run the same query again.
CREATE INDEX IX_Orders_CustomerID ON dbo.Orders (CustomerID) INCLUDE (Total);
GO
SELECT COUNT(*) AS Orders, SUM(Total) AS Revenue
FROM dbo.Orders
WHERE CustomerID = 17;
The Messages tab now reports logical reads 2. The same answer, 100 orders and revenue of 5570.00, cost 2 pages instead of 584. That is the kind of proof you want before and after any tuning change.
It Covers Updates Too
The settings aren’t limited to SELECT statements. Every statement that runs after them reports its reads and its time. This UPDATE changes the status of the same 100 orders.
UPDATE dbo.Orders
SET Status = 'Shipped'
WHERE CustomerID = 17;
| Statement | Logical reads on Orders |
|---|---|
| SELECT, no index | 584 |
| SELECT, with the covering index | 2 |
| UPDATE of 100 rows | 217 |
The UPDATE reports 217 logical reads. The index finds the 100 rows, and a lookup into the clustered index reaches each one. A write statement shows its cost the same way a query does. The settings only report. They don’t make a query faster.
With the options on, STATISTICS TIME and IO print their lines for every statement. Turn them off for a script that runs thousands of statements. A SET STATISTICS IO, TIME OFF line in the script does the same for one window.
Why Not Read the Plan Instead?
You could argue that the actual execution plan shows more than two lines of numbers. It does. It shows every operator, its row counts and its warnings. The numbers still answer a different question. Did this change reduce the work? A plan needs interpretation, while 584 against 2 doesn’t. I look at the statistics first and open the plan when the numbers say something is wrong.
What to Remember
STATISTICS TIME and IO report the cost of every statement in the Messages tab. Tick the two options in SSMS once, and open a new window to use them. Compare logical reads before and after a change, and treat the milliseconds as a rough guide.
The setting covers INSERT, UPDATE and DELETE as well as SELECT. When you finish with the demo, run the cleanup script.
SET STATISTICS IO, TIME OFF;
GO
USE master;
GO
ALTER DATABASE StatsTimeIoDemo SET SINGLE_USER WITH ROLLBACK IMMEDIATE;
DROP DATABASE StatsTimeIoDemo;
A query is not fast because it feels fast, it is fast because the pages it read say so.
Published by Pinal Dave on SQLAuthority. More of my work at pinaldave.com.
Discover more from SQL Authority with Pinal Dave
Subscribe to get the latest posts sent to your email.




1 Comment. Leave new
When we Enable Statistics Time and IO , It will improves SELECT statement or it will improves DML commands performance also?