
Object Explorer Query Tracking exposed SSMS queries while expanding nodes in the historical release. I used its Output window for investigation.

In that release, I opened View > Output, then expanded the Databases node in Object Explorer. The output showed the query used for the expansion and its elapsed time. That gave me a useful lead when a node was slow or returned an error.
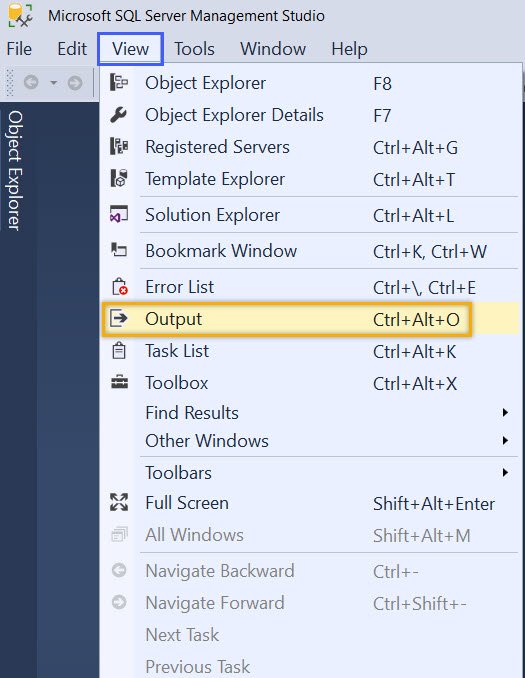
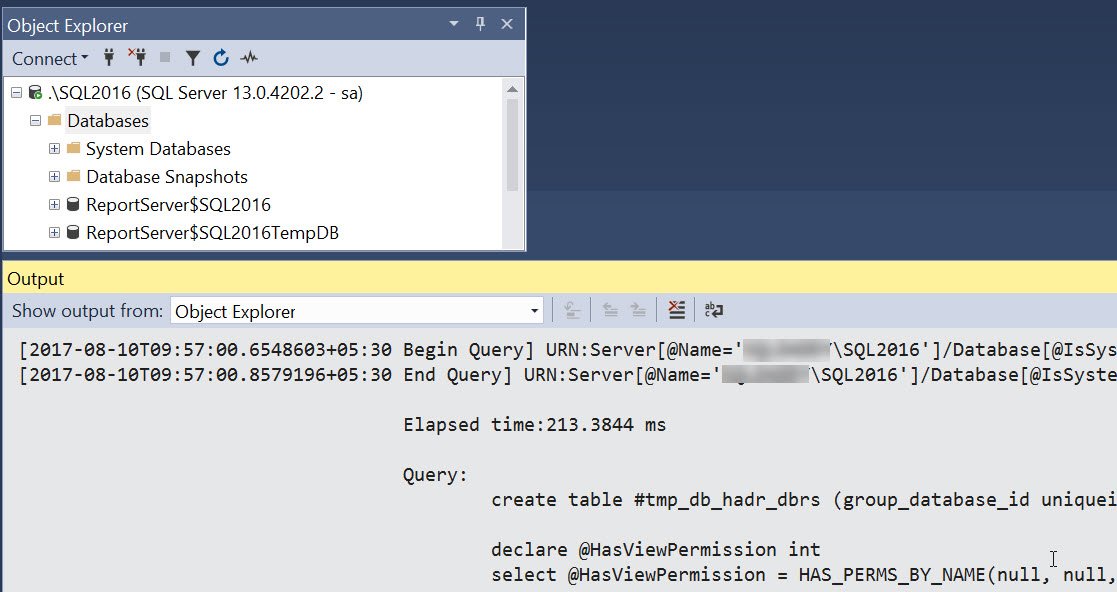
This demonstrates the 2017 SSMS release. Current Output categories and diagnostics depend on the installed build. Check those categories before expecting identical messages.
The feature didn’t capture node Properties-dialog queries. It also wasn’t a general workload profiler. I kept the query, error and timing together when investigating expansion. Server-side evidence helps confirm what happened.
Related reading
Object Explorer tracking is not a workload profiler, it is a diagnostic for the supported UI activity.
Published by Pinal Dave on SQLAuthority. More of my work at pinaldave.com.
Discover more from SQL Authority with Pinal Dave
Subscribe to get the latest posts sent to your email.



2 Comments. Leave new
Hi Pinal , Nice but How do you think this elapsed time detail of few queries will help DBA ?
This will help if you observe slowness in object explorer and want to find out which query it is.