
Question: Which cached query had the longest execution, and how can I see its execution plan?

This is a familiar interview question. The short answer is sys.dm_exec_query_stats, ordered by max_elapsed_time, with sys.dm_exec_query_plan applied to each plan handle. But the result is often described too loosely. It shows the slowest completed execution recorded for a currently cached plan, not every query that has ever run and not the statement currently running the longest.
Run this on the instance you want to inspect with VIEW SERVER PERFORMANCE STATE on SQL Server 2022 and later, or VIEW SERVER STATE on older versions:
SELECT TOP (10)
       SUBSTRING(st.text,
                 (qs.statement_start_offset / 2) + 1,
                 ((CASE WHEN qs.statement_end_offset = -1
                        THEN DATALENGTH(st.text)
                        ELSE qs.statement_end_offset END
                   - qs.statement_start_offset) / 2) + 1) AS StatementText,
       qs.execution_count AS ExecutionCount,
       qs.max_elapsed_time / 1000000.0 AS MaxElapsedSeconds,
       qs.total_elapsed_time / NULLIF(qs.execution_count, 0) / 1000000.0
           AS AvgElapsedSeconds,
       qs.last_execution_time AS LastExecutedAt,
       qp.query_plan AS QueryPlan
FROM sys.dm_exec_query_stats AS qs
CROSS APPLY sys.dm_exec_sql_text(qs.sql_handle) AS st
OUTER APPLY sys.dm_exec_query_plan(qs.plan_handle) AS qp
ORDER BY qs.max_elapsed_time DESC;
Each max_elapsed_time value is reported in microseconds, so the division displays seconds. The offsets isolate the statement from a multi-statement batch. In SSMS, the QueryPlan XML link opens the cached compiled plan. It is not an actual execution plan with per-operator runtime counts; collect an actual plan for a controlled execution when that evidence is needed. Start with the top row, but inspect the plan and runtime context before deciding what to tune.
These statistics describe completed executions while their plans remain cached. A plan may disappear after eviction, recompilation, or an instance restart, so absence from this list is not proof that a query was fast. If you need a longer history, use Query Store where it is enabled. If you need a query that is executing right now, examine sys.dm_exec_requests instead.
Try the XML link with a known query
For a small demonstration, run this in AdventureWorks2025. The marker filters the cache lookup to our Department query instead of displaying unrelated workload text. The execution count and duration can change between runs; the QueryPlan link is the point of this example.
USE AdventureWorks2025;
GO
SELECT DepartmentID, Name AS DepartmentName_IQ43655
FROM HumanResources.Department
WHERE GroupName = N'Research and Development'; -- IQ43655
GO
SELECT qs.execution_count AS ExecutionCount,
       qs.max_elapsed_time / 1000.0 AS MaxElapsedMilliseconds,
       qp.query_plan AS QueryPlan
FROM sys.dm_exec_query_stats AS qs
CROSS APPLY sys.dm_exec_sql_text(qs.sql_handle) AS st
OUTER APPLY sys.dm_exec_query_plan(qs.plan_handle) AS qp
WHERE qp.dbid = DB_ID(N'AdventureWorks2025')
  AND st.text LIKE N'%IQ' + N'43655%';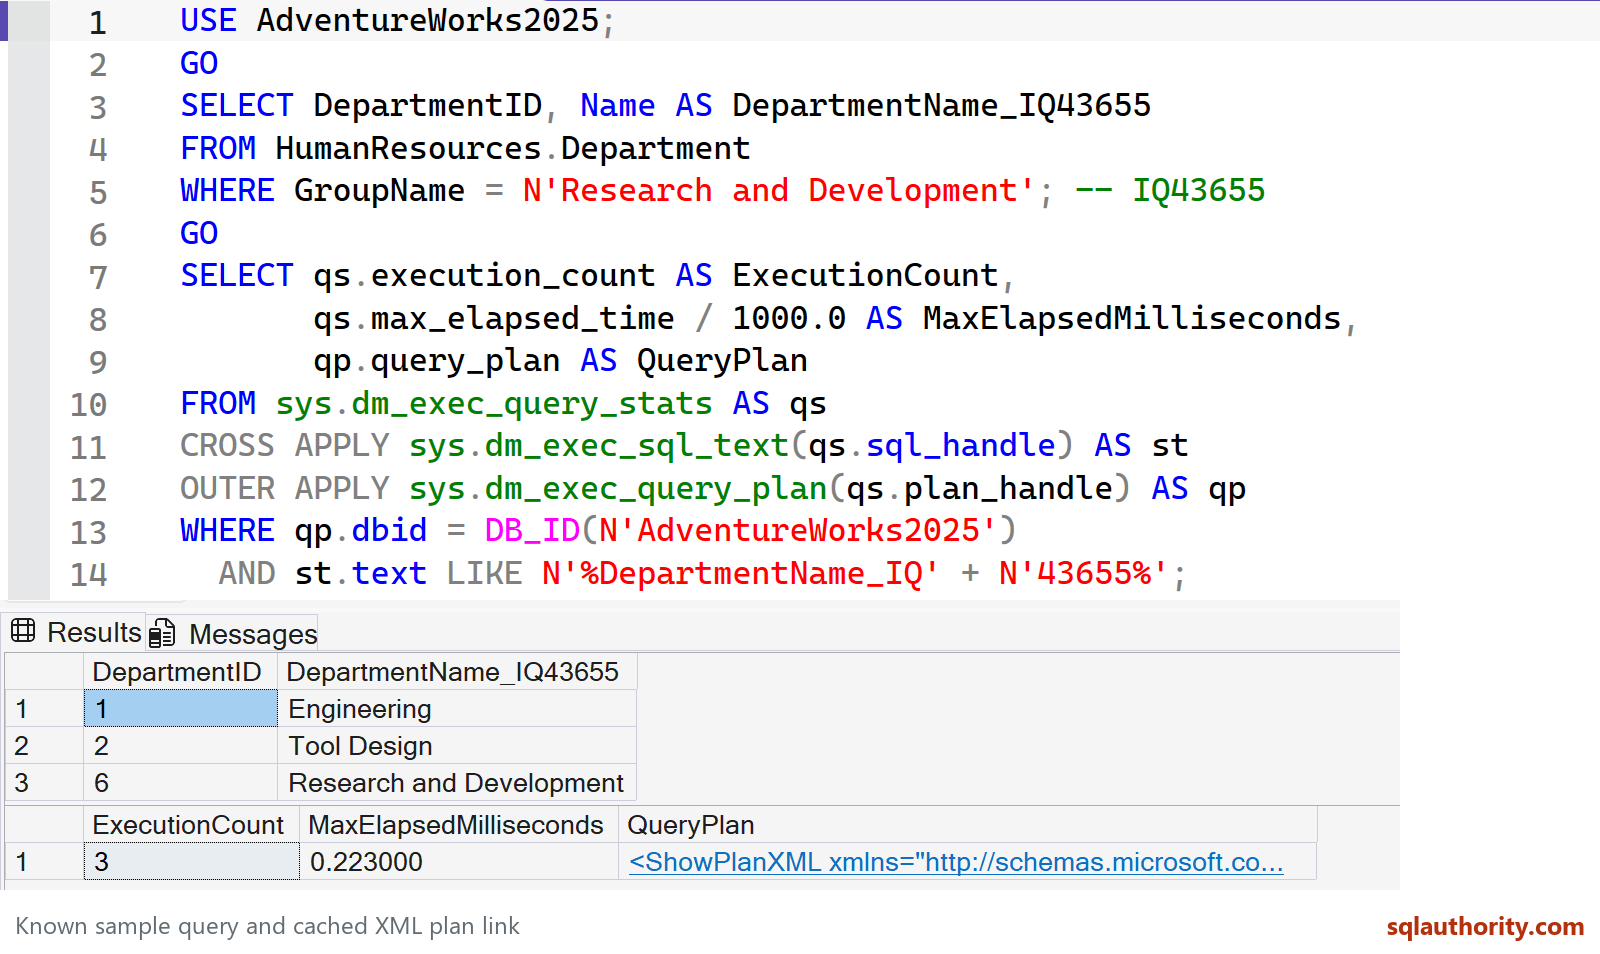
Click the QueryPlan XML cell in SSMS to inspect the compiled plan for that sample. An empty result means its plan is no longer available in the cache, not that the sample failed.
Once you have a useful plan, you can save and share an execution plan for review. The plan is evidence to inspect, not a substitute for reproducing the workload.
Published by Pinal Dave on SQLAuthority. More of my work at pinaldave.com.
Discover more from SQL Authority with Pinal Dave
Subscribe to get the latest posts sent to your email.




2 Comments. Leave new
Hello Pinal
How to find in MYSQL?
Means? Installation of MySQL?