This is a guest post by Bill Anton. Analysis Services performance monitoring comes down to one habit: take measurements before anyone complains.

 Bill Anton is a SQL Server expert. Clients bring Bill in to troubleshoot and fix their Analysis Services performance problems.
Why Good Cubes Slow Down
Few technologies rival a well-designed Analysis Services Multidimensional cube or Tabular model for ad hoc query speed. At the start, life is good. Then things change. The business evolves, and information workers ask different questions. The business grows, so more users ask more questions of larger data. Queries take longer. Nightly processing runs past the end of the maintenance window and into business hours. Users complain, and management is unhappy.
Then comes the question: how did we not see this coming? Clients who hire me to fix Analysis Services performance ask it in one form or another. In my experience, about 80 percent of the time nobody saw it coming because no monitoring solution existed. In the other 20 percent, a solution exists, but nobody reviews what it collects.
The Secret Is Simple
Analysis Services performance monitoring starts with measurements. Regular measurements are the only way to know how a system performs over time. That sounds obvious, yet few companies take them. My hunch is that people don’t know what to measure. Analysis Services has two kinds of workload, and each one needs its own measurements.
Processing Workloads
Processing loads data into the Analysis Services database. It runs at night, outside business hours, so it doesn’t collide with user activity. Two things need your attention.
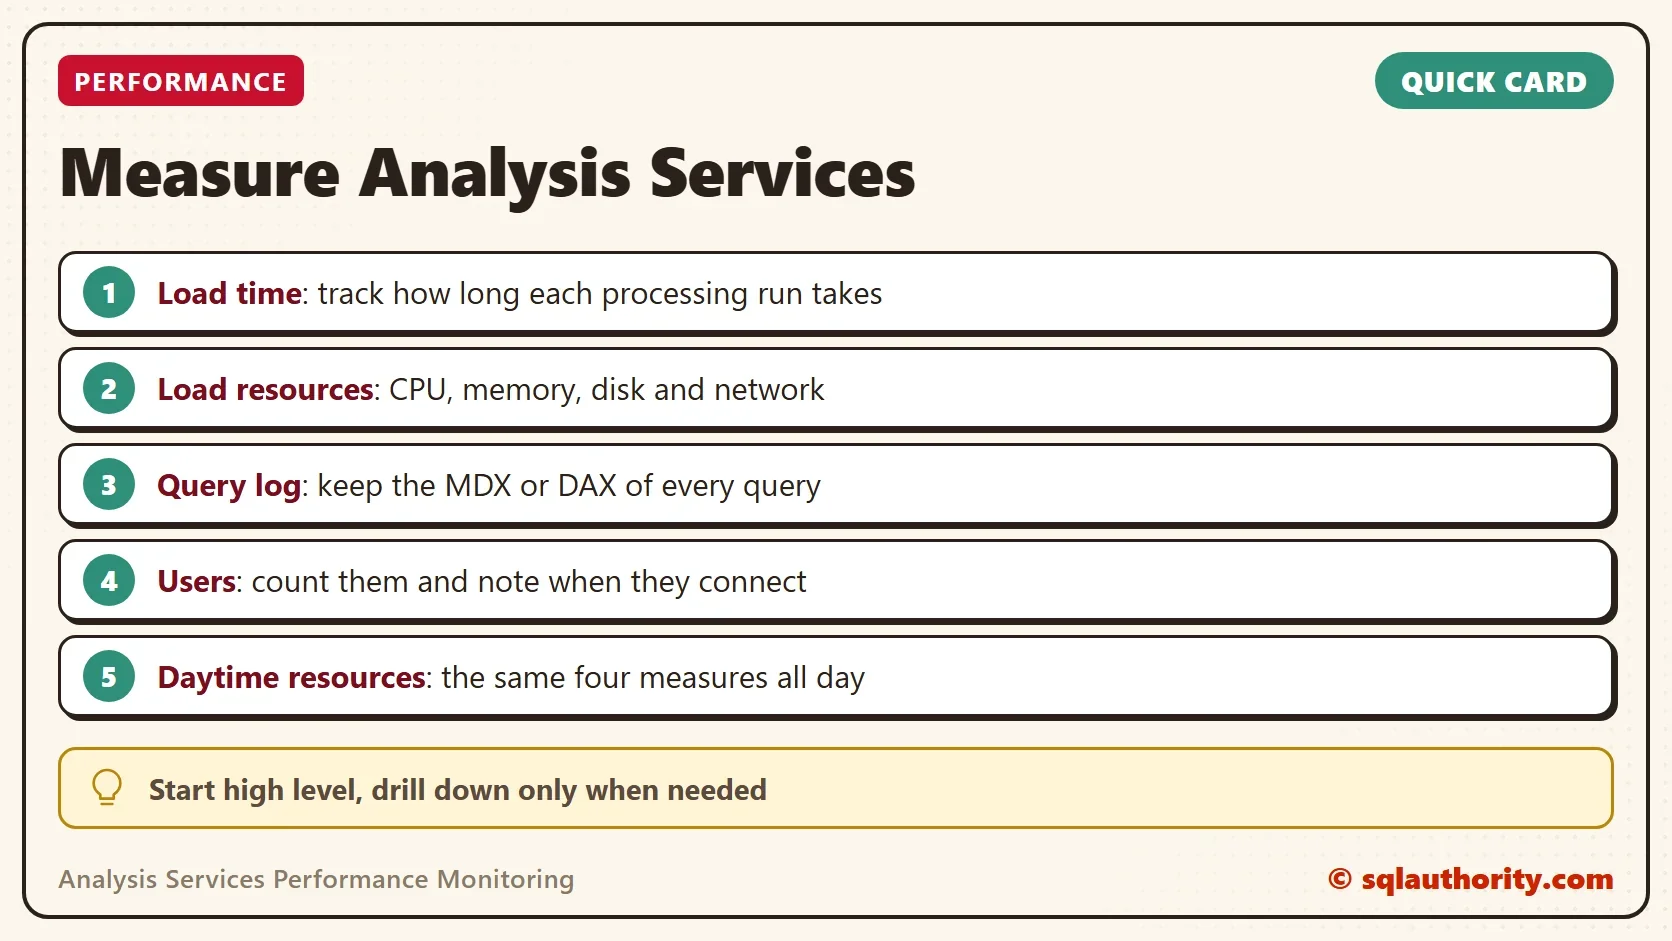
The first is processing duration, the time the load takes. While it fits inside the maintenance window, there is little to worry about. If the duration grows over time and will soon overrun the window, review the other measurements to learn why. Ask two questions. How long does processing take? Is that time increasing?
The second is resource consumption: CPU, memory, disk and network during the load. These numbers point to the bottleneck. Does the load need more memory each month? Is the CPU maxed out? How much disk space is left?
Many fixes exist, and without insight into the system you can’t pick the best one. Say one measure group in a Multidimensional cube takes longer to process each month. CPU, memory and disk have room to spare. You could partition that fact table and process only the newest partition. You could also process partitions in parallel.
Pro tip: split processing into stages. Then you can see which part of the database drives the growth in time or memory.
Query Workloads
A query workload is any activity that sends queries to the database: reports, dashboards, pivot tables. Users don’t run the same queries at the same time every day, so this workload is harder to watch. Start with the high-level items, and drill into detail only when a question needs it.
The most important item is a log of the queries that run. You see which ones are slow, and you have the MDX or DAX itself. You don’t wait for a complaint. You can start reviewing the query at once. Some teams have service level agreements, such as no query over 30 seconds and an average under 5 seconds. With every query logged, you know whether the agreement was broken and which queries led up to it.
Next, count the users and note when they connect. Those numbers tell you when to scale up or out. You can extract them from the query log, but they deserve their own line.
Last, track the same four resource measures during the day that you track during processing. They explain why a query is slow. Say the ten slowest queries of last week run fast now. Look at the system as it was last week at that hour. You could find memory pressure or a CPU spike caused by a burst of activity.
With these measurements, you can answer questions like these:
- What are the ten slowest queries each week?
- Who are the top users, and how many queries does each one run per day, week or month?
- What is the average number of users per day, week or month?
- What is the maximum and the average number of concurrent users per day, week or month?
Pro tip: the OLAPQueryLog table doesn’t hold whole queries. It stores parts of them, the storage engine requests. One query can create dozens of rows there. So the table doesn’t tell the whole story, and you can’t always see which queries are slow.
What to Remember
Take the measurements before you need them, and review them on a schedule. A log nobody reads belongs to the 20 percent case above. Analysis Services performance monitoring works only when someone looks at the results.
Knowing what to collect is the first step. How to collect it is the next one, and several options exist.
Note from Pinal: This article has no code, and the test server has no Analysis Services instance. Nothing here was run. Two common ways to collect the measurements are Windows Performance Monitor counters and an Extended Events session. A query log adds load to a slow server. Keep the first version small: the query text, the duration and the user. Store the results in a table, because a trend line from last month beats a guess.
A slow cube is not a surprise, it is a trend nobody measured.
Published by Pinal Dave on SQLAuthority. More of my work at pinaldave.com.
Discover more from SQL Authority with Pinal Dave
Subscribe to get the latest posts sent to your email.