
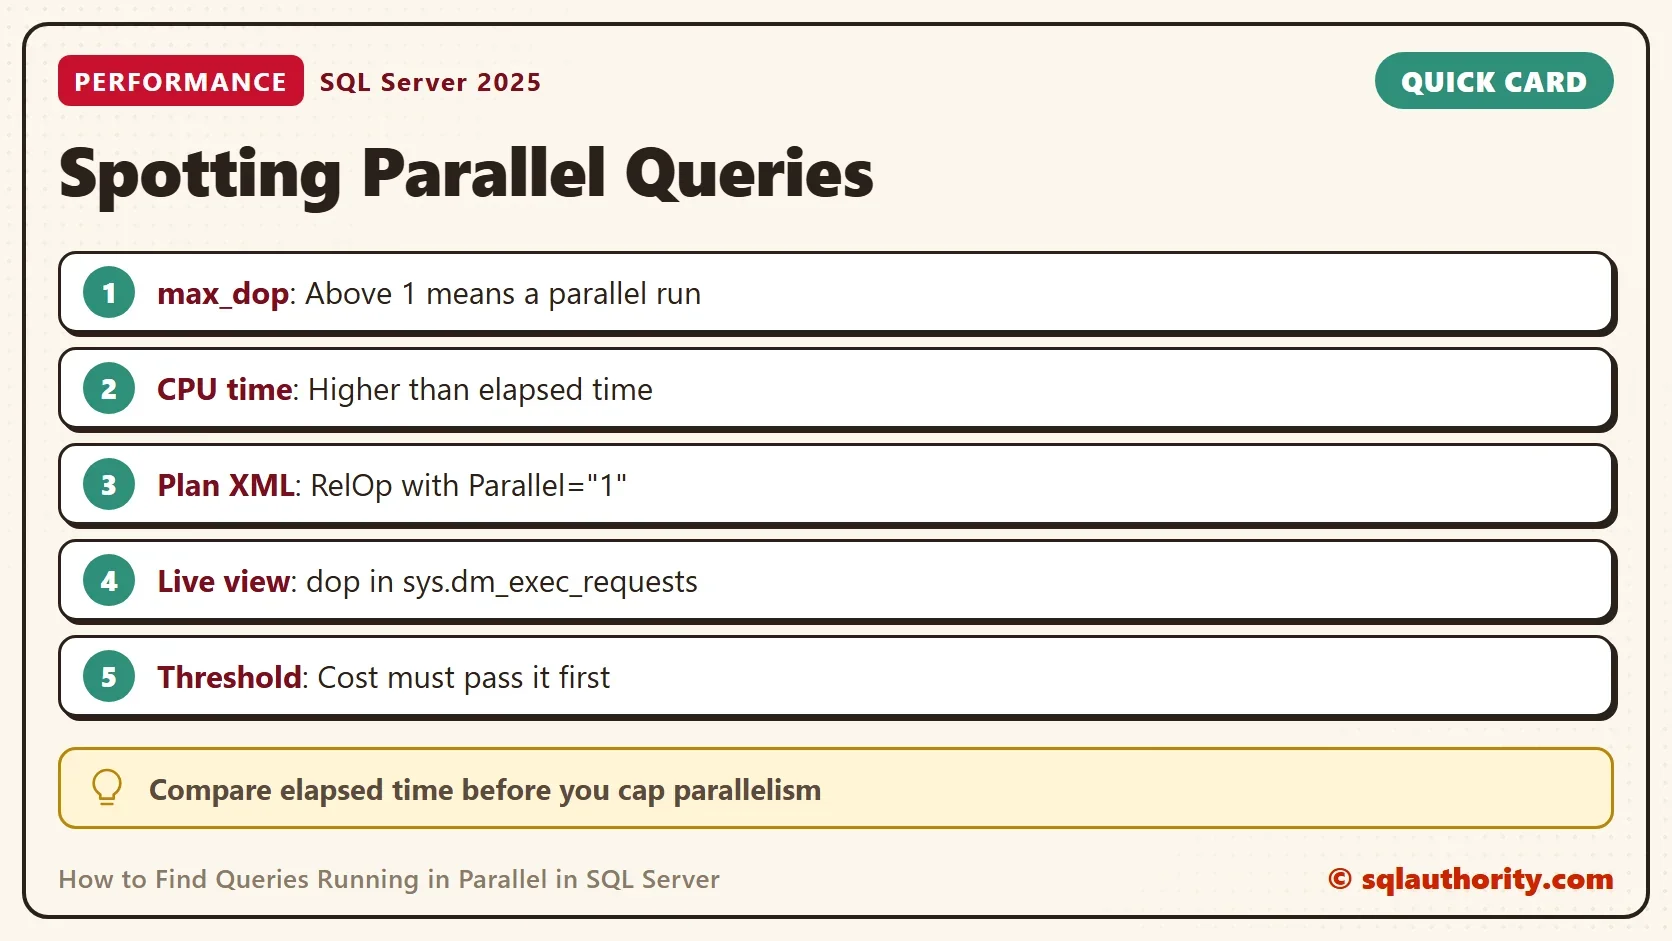
To find queries running in parallel, read max_dop and the CPU to elapsed ratio from the query stats view. Then confirm with the plan XML if you need to be sure. The tests below use one table and three runs of the same query, so each method has something to find.

Why a Query Goes Parallel
SQL Server considers a parallel plan when two conditions hold. The optimizer must estimate that the query costs more than the instance setting cost threshold for parallelism. The instance must also allow more than one worker through max degree of parallelism, which is called MAXDOP. A cheap query stays serial, however many cores the server has.
SELECT name, value_in_use
FROM sys.configurations
WHERE name IN (N'cost threshold for parallelism', N'max degree of parallelism')
ORDER BY name;
| name | value_in_use |
|---|---|
| cost threshold for parallelism | 50 |
| max degree of parallelism | 2 |
On the test instance the threshold is 50 and MAXDOP is 2. Your instance can differ. The built-in default threshold is 5, which is low for modern servers, and many teams raise it.
Build a Table Big Enough to Test
The demo table holds two million sales lines. The script creates its own database. GENERATE_SERIES fills the table, and it needs SQL Server 2022 and compatibility level 160. On older versions, use any numbers table instead.
IF DB_ID(N'ParallelPlanDemo') IS NULL CREATE DATABASE ParallelPlanDemo;
GO
USE ParallelPlanDemo;
GO
DROP TABLE IF EXISTS dbo.SaleLine;
CREATE TABLE dbo.SaleLine (SaleID int NOT NULL PRIMARY KEY, StoreID int NOT NULL, Amount decimal(10,2) NOT NULL);
INSERT dbo.SaleLine (SaleID, StoreID, Amount)
SELECT value, value % 500, (value % 9000) / 10.0 FROM GENERATE_SERIES(1, 2000000);
The next batch runs one query three times. The first run has no hint, so the optimizer decides alone. The second forbids parallelism. The third asks for a parallel plan with a documented hint. A short comment at the start of each statement tells the runs apart later.
SELECT /* plain */ TOP (5) StoreID, SUM(Amount) AS Total FROM dbo.SaleLine GROUP BY StoreID ORDER BY Total DESC;
GO
SELECT /* serial */ TOP (5) StoreID, SUM(Amount) AS Total FROM dbo.SaleLine GROUP BY StoreID ORDER BY Total DESC OPTION (MAXDOP 1);
GO
SELECT /* parallel */ TOP (5) StoreID, SUM(Amount) AS Total FROM dbo.SaleLine GROUP BY StoreID ORDER BY Total DESC OPTION (USE HINT('ENABLE_PARALLEL_PLAN_PREFERENCE'));
All three return the same five stores, with store 499 on top. The plain run stayed serial, even with two million rows. Its estimated cost was 11.661, below the threshold of 50, so the optimizer saw no reason to split the work. That’s the first lesson. The size of a table doesn’t decide it. The cost estimate does.
Method 1: Query Stats, DOP and CPU Time
To find queries running in parallel after the fact, use sys.dm_exec_query_stats. The view keeps totals for every cached plan. Its max_dop column holds the highest degree of parallelism the plan used. A second clue is the CPU time. A serial query uses about as much CPU time as clock time. A parallel query adds up the time of all its workers, so its CPU time rises above its elapsed time.
SELECT SUBSTRING(st.text, 1, 25) AS QueryStart, qs.max_dop,
       qs.total_worker_time / 1000 AS CpuMs, qs.total_elapsed_time / 1000 AS ElapsedMs
FROM sys.dm_exec_query_stats AS qs
CROSS APPLY sys.dm_exec_sql_text(qs.sql_handle) AS st
CROSS APPLY sys.dm_exec_plan_attributes(qs.plan_handle) AS pa
WHERE pa.attribute = N'dbid' AND pa.value = DB_ID()
  AND st.text LIKE N'SELECT /*%' AND st.text NOT LIKE N'%dm_exec_query_stats%'
ORDER BY qs.max_dop, QueryStart;| QueryStart | max_dop | CpuMs | ElapsedMs |
|---|---|---|---|
| SELECT /* plain */ TOP (5 | 1 | 211 | 211 |
| SELECT /* serial */ TOP ( | 1 | 210 | 213 |
| SELECT /* parallel */ TOP | 2 | 217 | 117 |
The parallel run shows max_dop 2. Its CPU time of 217 ms is well above its elapsed time of 117 ms. The two serial runs show equal times. These numbers come from one run and will differ on your machine. The pattern is the useful part.
This view has limits. It lists only plans that are still in the cache, and totals reset when a plan leaves it. A query that ran once last night and was evicted is gone.
Method 2: Look for a Parallel Operator in the Plan
The plan itself marks every parallel operator with Parallel="1". The XML search below confirms the result of method 1. It reads each plan, which is heavy on a busy server with thousands of plans. Narrow the rows first, as this query does with the database and the text.
SELECT SUBSTRING(st.text, 1, 25) AS QueryStart,
       p.query_plan.exist(N'declare namespace p="http://schemas.microsoft.com/sqlserver/2004/07/showplan"; //p:RelOp[@Parallel="1"]') AS HasParallelOperator
FROM sys.dm_exec_query_stats AS qs
CROSS APPLY sys.dm_exec_sql_text(qs.sql_handle) AS st
CROSS APPLY sys.dm_exec_query_plan(qs.plan_handle) AS p
CROSS APPLY sys.dm_exec_plan_attributes(qs.plan_handle) AS pa
WHERE pa.attribute = N'dbid' AND pa.value = DB_ID()
  AND st.text LIKE N'SELECT /*%' AND st.text NOT LIKE N'%dm_exec_query_stats%'
ORDER BY QueryStart;| QueryStart | HasParallelOperator |
|---|---|
| SELECT /* parallel */ TOP | 1 |
| SELECT /* plain */ TOP (5 | 0 |
| SELECT /* serial */ TOP ( | 0 |
Only the third plan has a parallel operator. A plan can carry the marker without a parallel run. A parallel plan can fall back to one thread when the server is short of workers. So read the plan and the DOP together.
Method 3: Watch a Request While It Runs
The first two methods look back. The view sys.dm_exec_requests looks at what runs right now. Its dop column shows the degree of parallelism of a running request. The parallel_worker_count column shows how many parallel workers it reserved. A serial request has a dop of 1. The query below reads the row of your own session, which is serial.
SELECT dop, parallel_worker_count FROM sys.dm_exec_requests WHERE session_id = @@SPID;
| dop | parallel_worker_count |
|---|---|
| 1 | NULL |
To catch another session, remove the filter and keep the rows where dop is above 1. You have to be quick, because a short query leaves the view within milliseconds. Method 1 catches the short ones after the fact.
What to Do When You Find Them
Queries running in parallel are not a bug. Compare the elapsed time of the parallel run with a serial run, as the test above did. If the parallel plan is faster, leave it. If it uses far more CPU for a small gain, look at the cause. A missing index or a scan of a big table is a common cause. After that, consider raising the cost threshold, so only expensive queries qualify. Cap MAXDOP with a hint or an instance setting only when you have measured the problem.
You could argue that a report running in parallel on a busy transaction system is the problem. It can be. Then the better fix is to separate the workloads, not to cap every query.
What to Remember
To list queries running in parallel, start with max_dop and the CPU to elapsed ratio. Confirm with the plan XML, and use the live view for the ones in progress. Run the cleanup script when you finish.
USE master;
GO
ALTER DATABASE ParallelPlanDemo SET SINGLE_USER WITH ROLLBACK IMMEDIATE;
DROP DATABASE ParallelPlanDemo;
A parallel plan is not a faster plan, it is a plan that spends more workers to finish sooner.
Published by Pinal Dave on SQLAuthority. More of my work at pinaldave.com.
Discover more from SQL Authority with Pinal Dave
Subscribe to get the latest posts sent to your email.



2 Comments. Leave new
One of the scenarios where I have found parallelism to be slower is when we have MIS reports running off an OLTP system. The aggregations in the queries for these reports is costly enough for the SQL Server database engine to opt for a parallel plan, but the normalized nature of the OLTP schema causes it to backfire and impact performance. In such cases, we explicitly ensure that these queries run under a MAXDOP setting of 1, i.e. no parallelism.
In my comment above, I forgot to add the part about how I found that parallelism was creating a problem. Ours is a legacy system (where the schema has evolved since the days of SQL 7.0 and continues to undergo enhancements and growth even today). When SQL Server 2005 was launched and we undertook a certification effort, that’s when we noticed that our reports were literally bringing the server down to a crawl. The change was that SQL Server 2005 came with support for parallelism – the moment we set it to 1 (at the instance level), the performance improved confirming our theory. Later on, we modified the queries to use the MAXDOP query hint wherever required.