In my last article, I talked about the basics of tabular data model and why use it. Then I demonstrated step by step creation of a basic tabular model project. In this part I’m going to throw some light on how to create measures and analyses in excel. Let us learn about the SSAS Tabular Data Model.
If you look at the tabular project closely, you will notice that we have not defined any measure yet. So, in the first step we will define the measure first. Open the solution and select the column you want to define as a measure. Then, click on the summation icon on the toolbar. You will see the aggregated results at the bottom of that column. You have also other choices as well like average, min, max, count and distinct count.

After creating the required measures, we need to analyze our data in excel. To do this, click on the excel icon in the upper left corner of the toolbar.

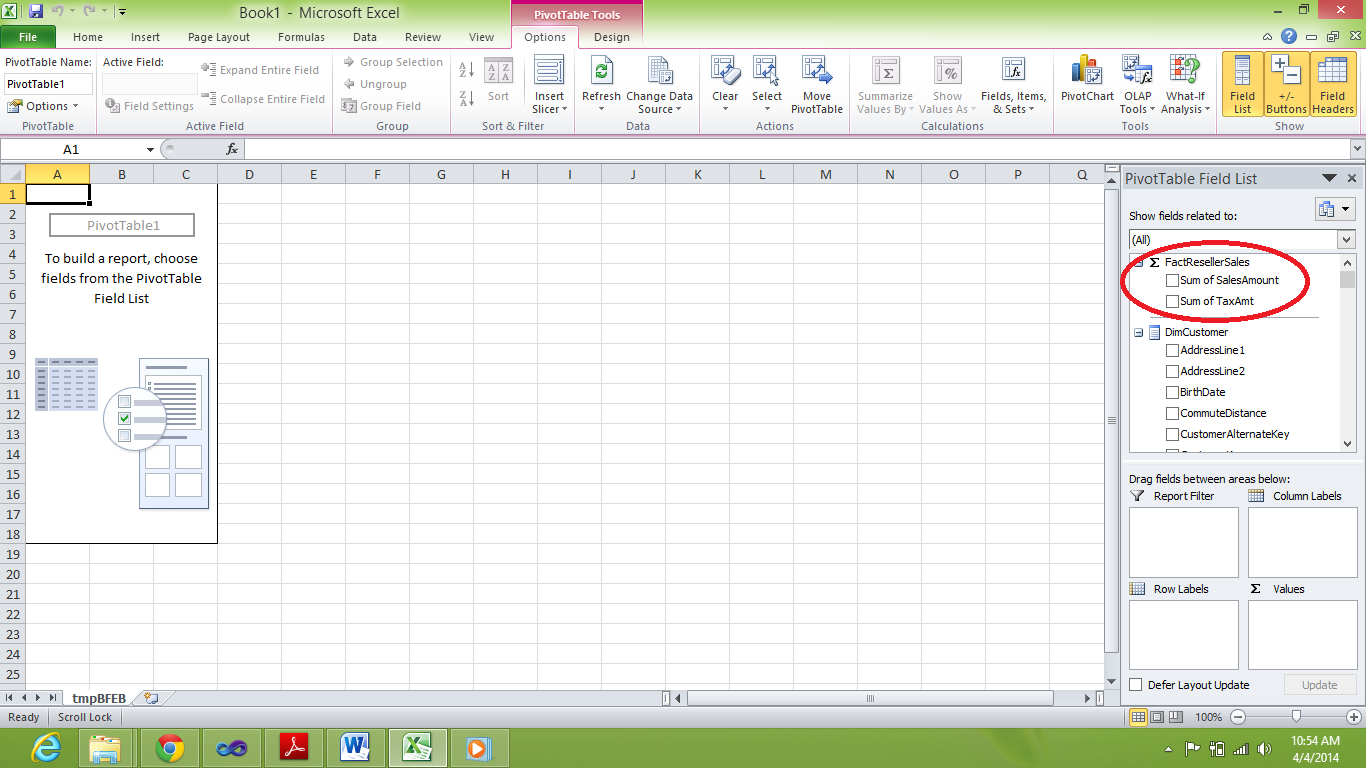
This will open your analysis in excel. Notice the pivot table field list here. I have highlighted the measures that we created in the earlier step. Now, we can use these measures in our analysis
Now, we have to put the required fields in their respective places as column labels, row labels, Values and Report filter for analysis. See below snapshot for details, it shows region wise sales on a yearly basis

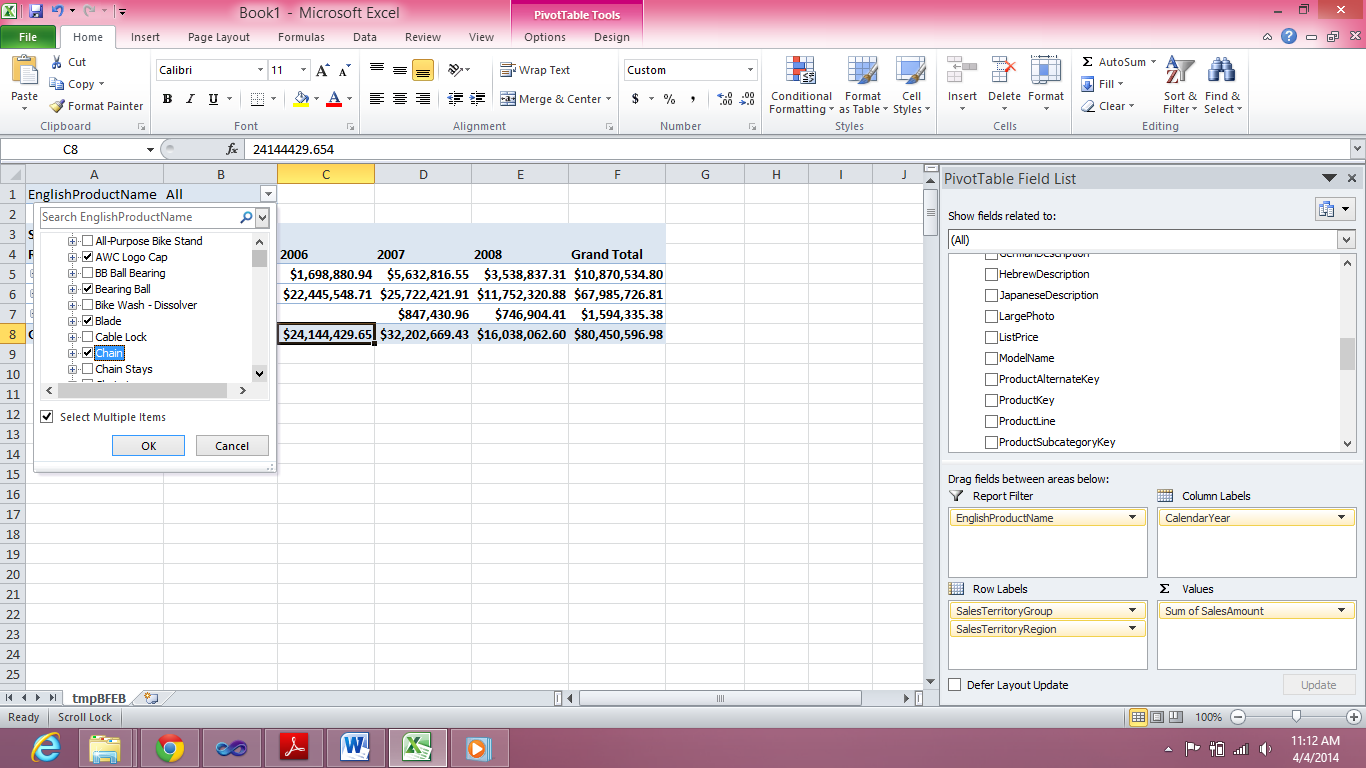
You can even apply filters on the above analysis by placing the slicer field in report filter. In our example, we will take an English product name as a filter.
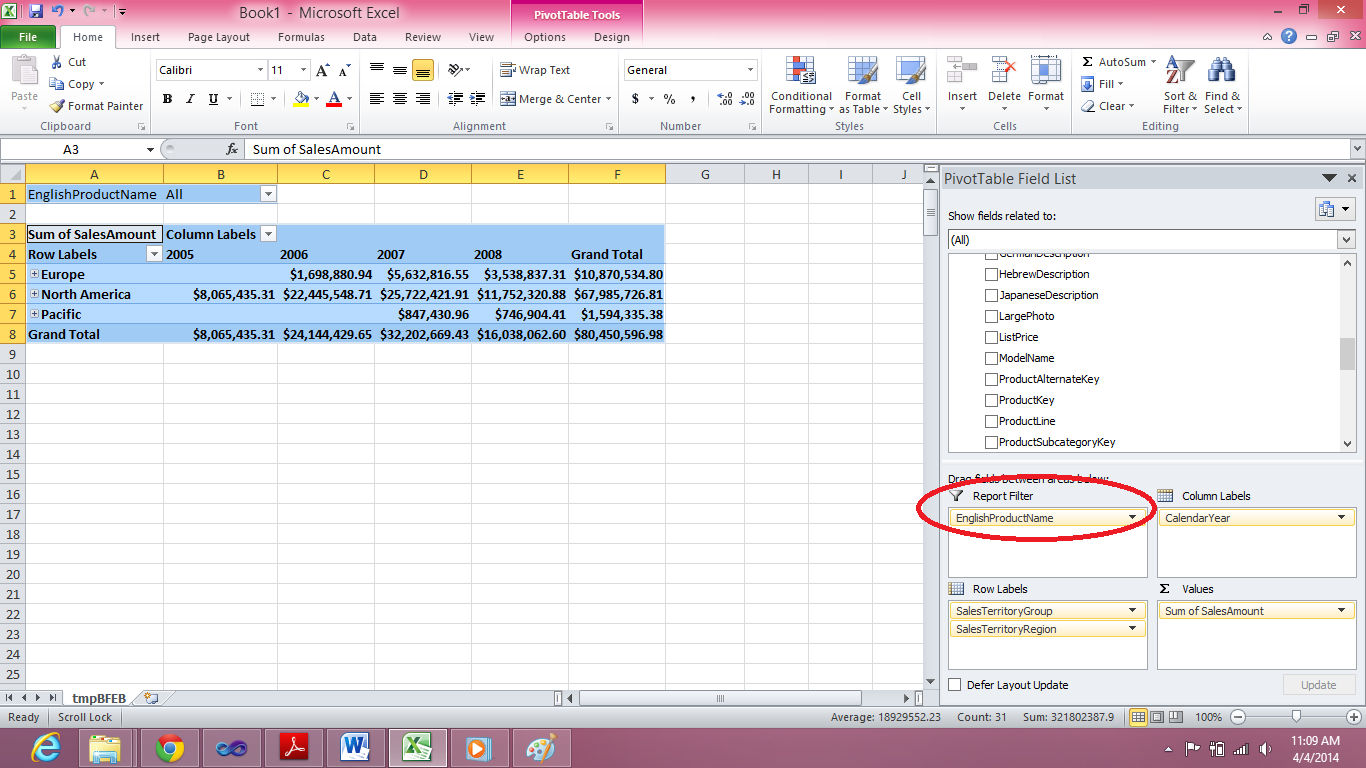
You can use the filter as depicted in the below snapshot.
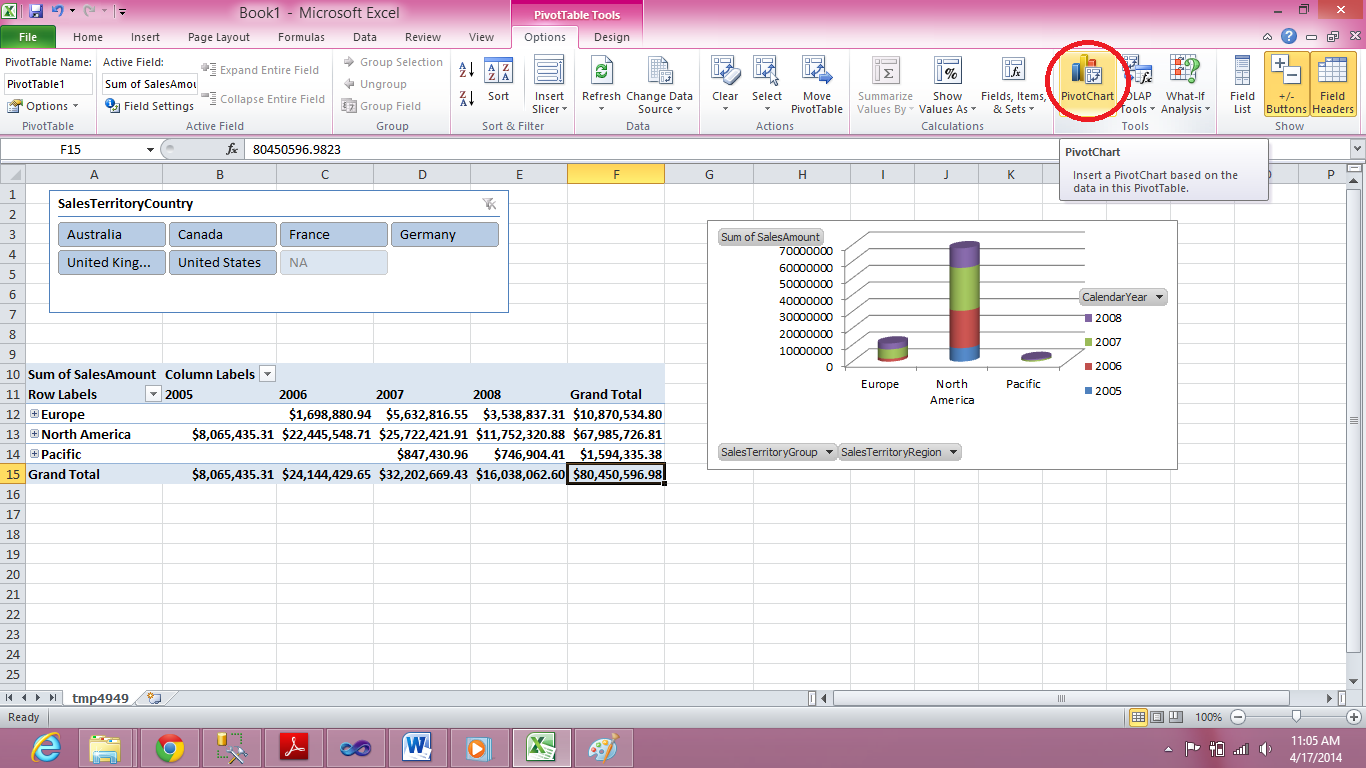
Optionally, you can also use the slider to filter data more interactively.

Further to improve our analysis, we can insert pivot charts
That’s all for this time, in my next post I’m going to show in detail about how to create hierarchies, perspectives, KPI’s and many more features. Thanks Namita for helping with the article.
Published by Pinal Dave on SQLAuthority. More of my work at pinaldave.com.