This is the guest blog post written by James Davies, Sales Engineer, Confio Software, a SolarWinds company. It is written based on the Database Performance Analyzer. I encourage you to download it for free from here.
From the moment a query request is made until the query response is delivered, what really happens to your query in SQL Server? Let’s find out, and talk about why that matters to you.
Put simply, queries in SQL Server can exist in one of three states while executing inside the database engine. These states are defined as:
- RUNNING–meaning that the query is actively running on the CPU
- RUNNABLE–meaning that the query is ready to run but CPU resources are not yet available. It is waiting in the Runnable Queue for a CPU to open up
- SUSPENDED–meaning that the query is waiting for a third party resource to become available (for example,, disk I/O, blocking and so on)
In an overly simplified way, it’s a bit like the checkout line at the grocery store, in which each shopper has just one item. The cashier is the CPU and the item the checker is actively scanning is like a query that is running. The shoppers waiting in line, each with their own item, are like runnable queries, just waiting to be scanned and checked out. Let’s say that when the checker scans your item, the price doesn’t come up, and a price check is called. The checker asks you to step aside, and wait for the price check to complete. When the price comes back, the checker asks you to step back in line, all the way at the end of the line. That’s like a suspended query (and that’s not something you want to happen to your query!). If there are four checkout lines running, then that would be a bit like having four CPU cores, each with their own set of queries in various states of running, runnable and suspended.
So then what is a wait type? In SQL Server wait types are simply a more detailed explanation of the suspension state. As DBAs, we don’t like to see queries in the suspended state, and want to find out just what is causing the query not to process.
When you look at wait statistics, you want to see queries spending the majority of their time in a running or runnable state. You can also use wait statistics to discover why a query is in a suspended state. If you can answer that question, you can fix the problem so that the query is mostly in a non-suspended state. And this is why understanding your query wait statistics is key to maximizing query performance.
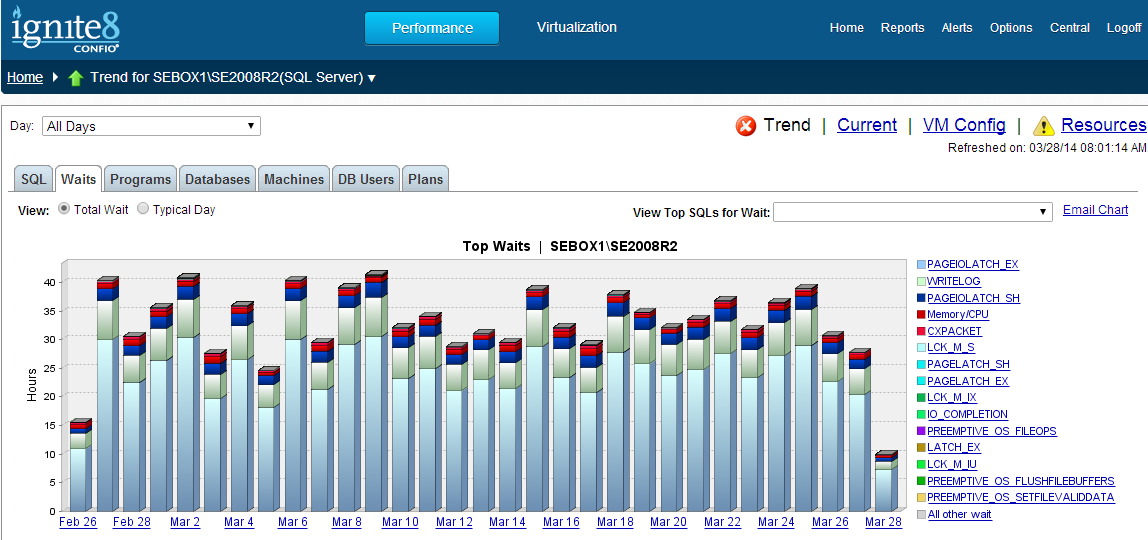
You can look at wait statistics using SQL Server Management Studio (SSMS) or third-party tools such as SolarWinds Database Performance Analyzer (DPA). DPA provides simple, fast and visual identification of query wait statistics correlated with system resources, including historical and trend information, so that you can easily pinpoint root cause of query performance issues.

Database Performance Analyzer (formerly Confio Ignite) Shows Top Waits and Which Resources Are Being Waited On
Whichever tools you use, understanding query states and wait statistics is the foundation to a good proactive database performance practice.
Reference: Pinal Dave (https://blog.sqlauthority.com)


2 Comments. Leave new
Hi Pinal,
Please explain how OLTP entity relationship consisting of two dimensional table whereas DWH is multi- dimensional table?
Hi , can you plz provide me a scipt by which i can shrink all the log files on the instance.thanks a lot.