PERCENT_RANK versus CUME_DIST reveals different answers when values share a position. I choose the question before choosing the function. A rank location and the share through a value are related, but they are not interchangeable.

Keep ties in the analytic ordering
The first query contains five rows and one repeated score. It also includes a missing score. Those inputs expose differences that a list of unique positive numbers can hide.
Both window expressions order only by Score. That preserves the two rows scoring ten as peers. The final display order adds RowId so those peer rows appear in a predictable sequence.
I keep the display key out of the analytic ordering deliberately. Adding RowId inside the window would make every ordering tuple unique. It would answer a different question about positions of individual rows.
The output casts the approximate function results to six decimal places. That creates a compact display model. It does not redefine either function as exact decimal arithmetic.
WITH Scores AS
(
    SELECT RowId,Score
    FROM (VALUES (1,CAST(NULL AS int)),(2,10),(3,10),(4,20),(5,30))
        AS v(RowId,Score)
)
SELECT RowId,Score,
    CAST(PERCENT_RANK() OVER (ORDER BY Score) AS decimal(9,6)) AS PercentRank,
    CAST(CUME_DIST() OVER (ORDER BY Score) AS decimal(9,6)) AS CumulativeShare
FROM Scores
ORDER BY Score,RowId;
Read the two answers beside each other
The expected PERCENT_RANK sequence is zero, 0.25, 0.25, 0.75 and one. The repeated score shares its rank location. The next score reflects the positions occupied by both tied rows.
The expected cumulative shares are 0.2, 0.6, 0.6, 0.8 and one. At score ten, three of the five ordered rows have been included. Both peer rows therefore report the same share through that group.
The missing score participates at the low end of this ascending example. Its rank location is zero, but its cumulative share is 0.2. That first row alone shows why the columns cannot be treated as aliases.
The formula for PERCENT_RANK uses rank minus one over row count minus one. CUME_DIST counts through the current peer group over the full row count. The two denominators also differ.
Try the smallest possible group
The second query supplies exactly one row. Its expected rank location is zero. Its expected cumulative share is one because the whole group has been reached.
There is no earlier or later row in that group. The two answers remain different without any ties. This is a useful boundary case when an application sometimes partitions down to one record.
I wouldn’t replace one result with the other merely to avoid a zero. The singleton outputs follow different meanings. Decide whether the application needs a relative rank or a cumulative share.
SELECT
    CAST(PERCENT_RANK() OVER (ORDER BY Score) AS decimal(9,6)) AS PercentRank,
    CAST(CUME_DIST() OVER (ORDER BY Score) AS decimal(9,6)) AS CumulativeShare
FROM (VALUES (CAST(10 AS int))) AS v(Score);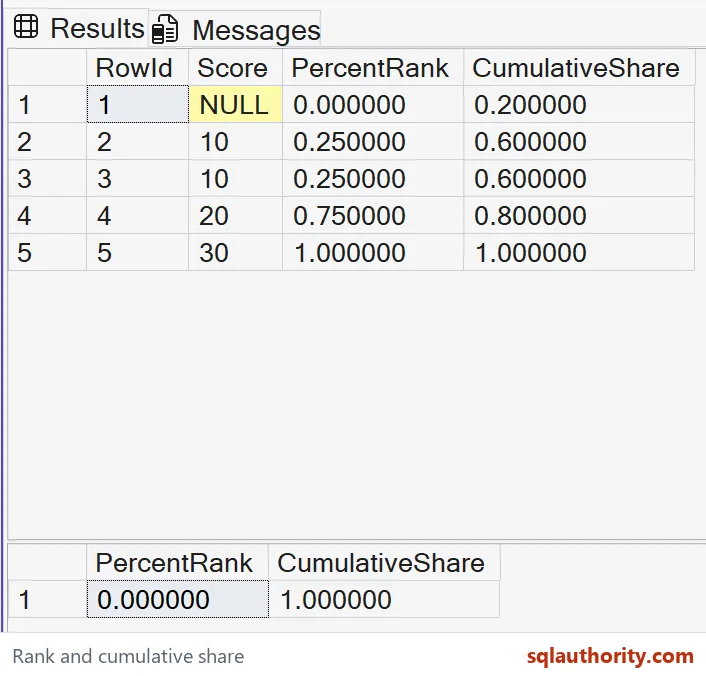

Define the population before interpreting a percentage
PARTITION BY can restrict each calculation to a named group. A missing partition clause uses all supplied rows together. Filtering the source changes that population before either window expression calculates its result.
If missing scores should be excluded, remove them deliberately before the windows. That changes the row count and the resulting shares. Replacing NULL with zero instead introduces an actual score and may create new ties.
I’d keep the group definition beside a report label. A percentage across every department differs from a percentage within one department. An identical function call does not make those populations comparable.
These functions measure relative positions in the supplied data. They do not establish a business threshold or a statistical significance claim. A percentile label should describe which interpretation the report actually selected.
These queries change no tables or settings and use only small made-up inputs. Add duplicate low and high scores when adapting it. Check the complete peer groups rather than only the last row, where both columns can coincide.
Pick the question first, and the function picks itself.
A rank location is not a cumulative share, it is a different description of the same ordered population.
Published by Pinal Dave on SQLAuthority. More of my work at pinaldave.com.
Discover more from SQL Authority with Pinal Dave
Subscribe to get the latest posts sent to your email.