 There are many performance counters available in SQL Server which can be used to monitor various parameters of SQL Server engine. Have you ever been into a situation where you want to see value in performance counter for a query which you have returned? Imagine a situation where you want to look at fragmentation or numbers of rows in a table over a period of time. And you want to plot the values against standard performance counters available.
SQL Server had this feature from a long time. I noticed it recently while working with one of my friend. He was showing me the impact of a number of database vs the number of threads in the AlwaysOn availability group. He showed me graph and my first question was – how did you plot the number of databases with that counter? The answer was – using a user counter. I did further research and learned something new so sharing that with you in the form of this blog.
There are ten system procedures which are available in SQL Server, which allows user to set specific counter values. They are sp_user_counter1, sp_user_counter2… till sp_user_counter10. That’s why they are called user settable counters. Below is the screenshot of Performance Monitor. (Start > Run > PerfMon)

These counters can be populated using stored procedures. Counter Object name and stored procedure names are same. This means the values for “User Counter 1” can using sp_user_counter1, values for “User counter 2” can using sp_user_counter2 and so on.
Here is a quick example to demonstrate the usage.
-- Drop database, if already present

USE MASTER

GO

IF EXISTS (

SELECT *

FROM sys.databases

WHERE NAME = 'SQLAuthority'

)

BEGIN

ALTER DATABASE SQLAuthority SET single_user WITH ROLLBACK IMMEDIATE;

DROP DATABASE SQLAuthority;

END

GO

-- Create New Database

CREATE DATABASE SQLAuthority

GO

-- Create Objects Needed for Demo

USE SQLAuthority

GO

CREATE TABLE TrackMe (i INT)

GO

-- while loop to populate the data and populate the counter

SET NOCOUNT ON

DECLARE @NumberOfRows INT=0,@NumberOfRows_2 INT=0

WHILE (@NumberOfRows<25)

BEGIN

INSERT INTO TrackMe VALUES (1), (2), (3)

SELECT @NumberOfRows = COUNT(*) FROM TrackMe

EXECUTE sp_user_counter1 @NumberOfRows        -- 3, 6, 9, 12...

WAITFOR delay '00:00:02'

SELECT @NumberOfRows_2 = @NumberOfRows*2

EXECUTE sp_user_counter2 @NumberOfRows_2    -- 6, 12, 18, 24...

WAITFOR delay '00:00:02'

END

-- loop finished reset the counters

EXECUTE sp_user_counter1 0

EXECUTE sp_user_counter2 0
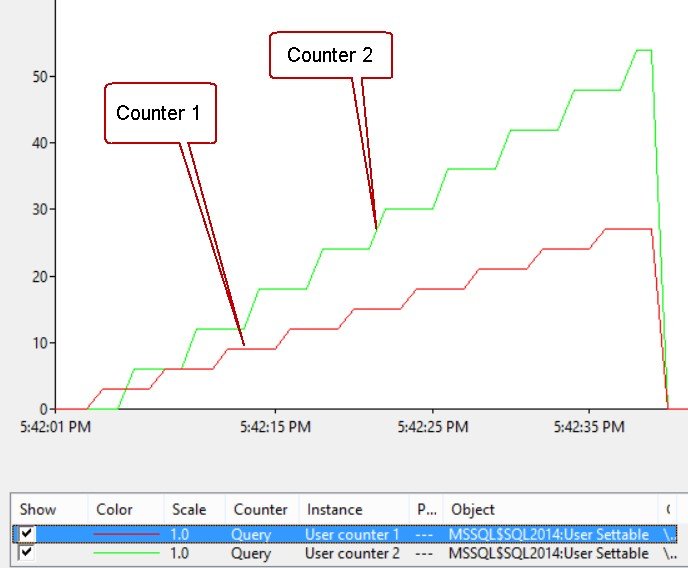
Here is the Performance counter graph where I have captured the counters.

Let me explain little logic of the script. My script is plotting number of rows in the table as counter1 and double of that as counter2. There is a delay of 2 seconds added between each counter so that we can see steps. Once the number of rows in the table are around 50, I am ending the loop and resetting the values to zero. That’s when you are seeing a drop at the end.
If you look at the procedure, it is straight forward. Believe me, here is the code.
CREATE PROCEDURE sys.sp_user_counter1 @newvalue INT AS

DBCC setinstance ('SQLServer:User Settable', 'Query', 'User counter 1', @newvalue)
Which means, we can also call undocumented command DBCC SETINSTANCE directly to set value for the counters.
Can you think of more innovative use of drawing value in performance monitor?
Reference: Pinal Dave (https://blog.sqlauthority.com)


