Let me start this blog post with a personal story.
Personal Story – Dad and I
My fascination for computers started way back when I was about to get into highschool. My father once took me to his office (was for some family day if I remember correctly) and it was fun to watch the PC. Interestingly enough, it was the only color PC in that office it seems – for those days it was a green font’s print CRT monitor. I am not sure how many even had a chance to work on those PC’s. It is a lost era for this generation.
Even from that time the most discussed part of these computers have been its processors – if I remember correctly, it was the 32-bit processors (pre-Pentium era) and the Hard-disks with the (3 ½ inch Floppy drives). It was an era where having few MB’s of data was a big deal.
Fast forward to today, all these stories seem like a great recreation for my daughters bedtime stories. Moore’s Law has proved itself for more than 4 decades and still amuses us. The processors these days on our watch / handheld devices are more powerful (by a factor of 1000x at least) than what we used to work on a PC 15-20 years back. The days are surely changing so should we! I am not sure what the innovations and technology would be when my daughter grows up.
Back to SQL Server
In today’s context, the advancements in technology have not stopped us from troubleshooting these parameters even today. Whenever I get involved in performance tuning exercise, one of the first questions I ask is – “What is the CPU utilization?”, “How is Memory consumption?”, “How is Disk activity and Disk queue length?” and “How is the network doing?”
So for today’s blog post, we will concentrate on 4 different reports:
- Top Queries by Average CPU Time
- Top Queries by Total CPU Time
- Top Queries by Average IO Time
- Top Queries by Total IO Time
These are the standard reports from the Server node. Go to Server Node -> Right Click -> Reports -> Standard Reports and you will find these in SQL Server Management Studio.
Top Queries by Average CPU Time
When it comes to CPU, for me Perfmon is still the primary tool for tracking down fundamental CPU usage and I feel it should remain so for you. However, from time to time we need to track down which process is using a physical CPU. When DBA’s ask me why SQL Server using all the CPU, I ask them the first question – are you sure SQL Server is the process utilizing CPU on server.
Just for the records, I typically read and used the kernel debugger to determine what process is using which exact CPU. For a primer take a look at how to use XPerf tool on MSDN Blogs.
Though these tools are powerful, there is a considerable learning curve for a novice DBA. So let me come back to favorite tool of choice – SQL Server Management Studio. Let us start to look at the Top Queries by Average CPU Time report. The output has two sections: a) Graph Section and b) Details Section.

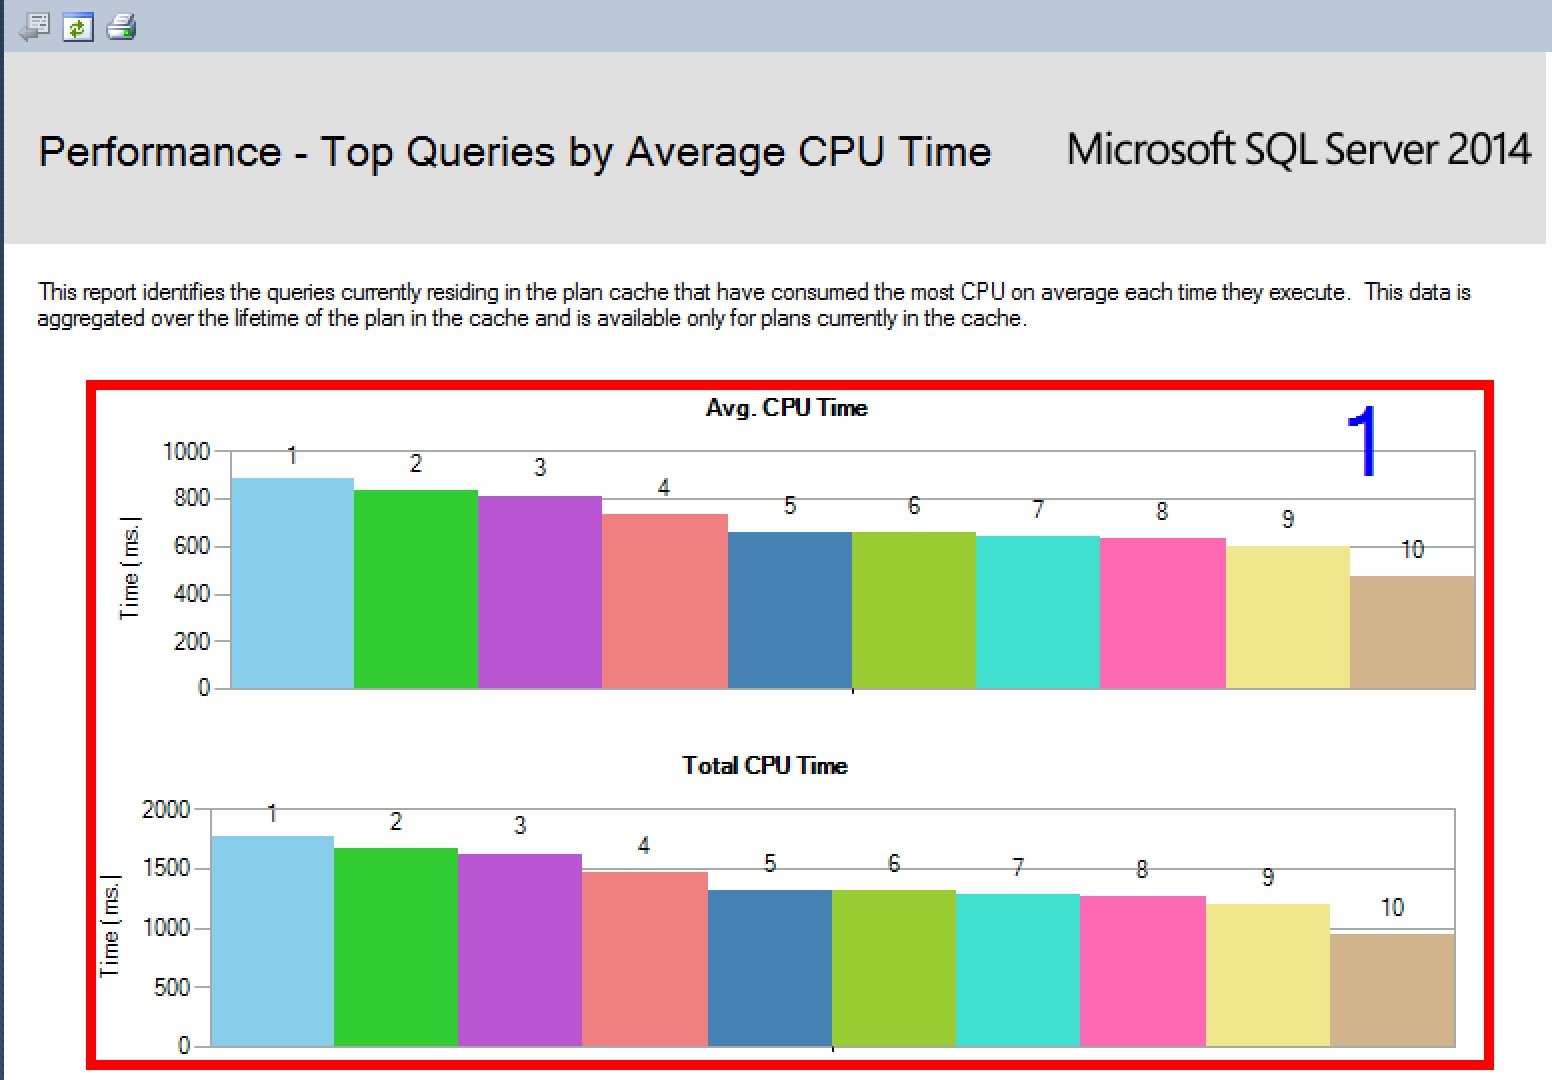
The first Graph section is a color palette sorted in descending order the Top queries that are consuming Average CPU Time and Total CPU Time. For me the next section has more interesting details to analyze. Before I jump there – there is an important note on the top of the report that is worth a look. It reads as:
Note: This report identifies the queries currently residing in the plan cache that have consumed the most total CPU time over the course of all their executions. This data is aggregated over the lifetime of the plan in the cache and is available only for plans currently in the cache.
This means that the values will get reset if SQL Server has been restarted because the cache gets flushed and emptied. In your active transactional system this will never be the case and I am sure you will know where to start your tuning exercise when SQL Server is utilizing higher CPUs.

As I mentioned, the second section is of higher interesting values to look at. As you can see, the Top 10 CPU consuming queries are listed and we can start investigating what is the resource utilization of each of these queries and how we can tune them. The label of the colors (1, 2, 3 etc.) are “Query No.” column in the table. It is quite possible that the order in the second graph may not be same as first graph.
In the above picture we can see that the Top most expensive query is utilizing close to 1.774 seconds to execute and on an average of 2 executions it is taking close to 0.887 seconds for each execution. The query under question is also highlighted under the Query Text.
Top Queries by Total CPU Time

Since the output is almost similar to what we discussed before. The queries are sorted by Top CPU time now. That is the only difference. The rough DMV’s used for this report would be:
SELECT TOP(10)

creation_time

,       last_execution_time

,       (total_worker_time+0.0)/1000 AS total_worker_time

,       (total_worker_time+0.0)/(execution_count*1000) AS [AvgCPUTime]
,       execution_count

FROM sys.dm_exec_query_stats  qs

CROSS APPLY sys.dm_exec_sql_text(sql_handle) st

WHERE total_worker_time > 0

ORDER BY total_worker_time DESC
Before I sign off on CPU utilization, I have always relied on this report for CPU workloads. But as a primer there are obvious candidates that I always look out to when CPU is high like:
- Query Execution and Parallelism
- Compiles and recompiles on the server
- Any tracing if enabled in the system – includes running of Activity Monitor somewhere or Profiler (we can use sys.traces to check traces which are configured to run)
- If any anti-virus is running in the system.
- Invalid drivers for SAN, BIOS or other components
These are some great starting points to eliminate before going into tuning queries for a CPU deprived system.
Performance – Top Queries by Average IO

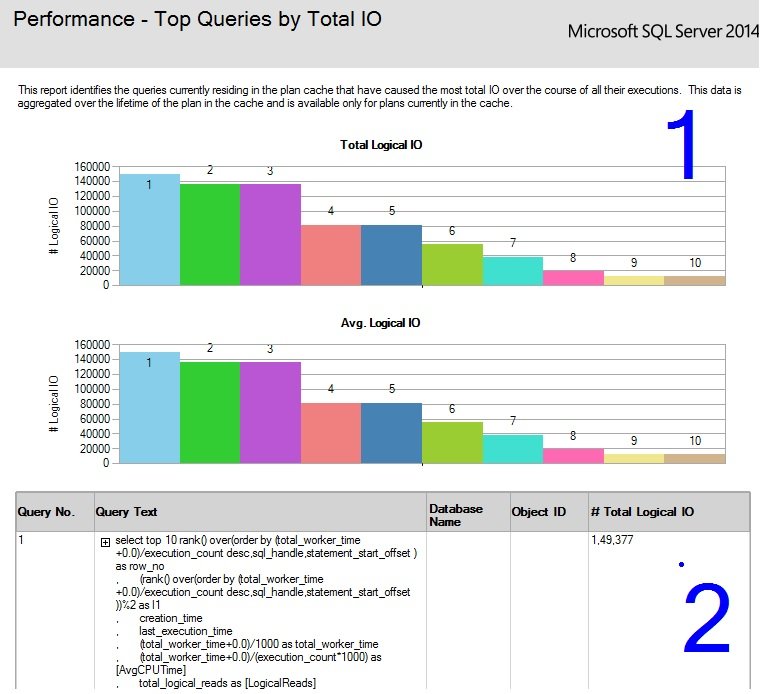
As described for the CPU output, the output is almost the same here too with two sections. The difference is, it has been sorted by Average IO utilization.
The meat of information is available in section 2 as usual.

This section apart from CPU values, has also the values of Logical Reads, Logical Writes. As you can see, Total Logical IO = Logical Reads + Logical Writes
The query to get this information would be:
SELECT TOP 10

creation_time

,       last_execution_time

,       total_logical_reads AS [LogicalReads]
,       total_logical_writes AS [LogicalWrites]
,       execution_count

,       total_logical_reads+total_logical_writes AS [AggIO]
,       (total_logical_reads+total_logical_writes)/(execution_count+0.0) AS [AvgIO]
,      st.TEXT

,       DB_NAME(st.dbid) AS database_name

,       st.objectid AS OBJECT_ID

FROM sys.dm_exec_query_stats  qs

CROSS APPLY sys.dm_exec_sql_text(sql_handle) st

WHERE total_logical_reads+total_logical_writes > 0

AND sql_handle IS NOT NULL

ORDER BY [AggIO] DESC
It is important to understand that IO for a query is a SUM of both Logical IO and Physical IO. Irrespective of where the data resides the IO is calculated as a Union of these two values.
Performance – Top Queries by Total IO

This output is identical to the previous output with the only difference of it being sorted by the Total IO parameter. The sections and output are exactly same as above reports.
As I sign off this post, wanted to know if anyone has used any of these reports or do you rely on using DMVs and other tools to troubleshoot CPU and/or IO related problems inside SQL Server? Do share your experience.
Reference: Pinal Dave (https://blog.sqlauthority.com)


13 Comments. Leave new
Such a great explanation as always
I have many databases on the server. When I run the ‘Top Queries by Total IO’ report, the Database Name column is empty. Why is that? I am unable to know quickly which db the queries are running against. Thanks.
I’m using sql2012 with the same issue…
I run this report in SSMS and there is a Print option. However, when I try to print the report I only get the first 2 pages of the report. I tried using the Print-save to PDF (Scansoft) option, but the PDF file only has 2 pages also. How can I get the entire report to print or save to PDF from SSMS?
Is it possible to correlate SQL Total Worker time and OS % Processor Time?
How can I get the cpu usage and memory usage of a particular sql of my choosing. Like Select * from Employee. I want to know the CPU usage and memory of this query.
You can try below.
set statistics time on
go
go
set statistics time off
go
You can also look at XML plan to get memory requirement for a given query.
Thanks Mr. Dave I got it now. One thing I would like to add is that I was first looking for it in Results section whereas I found it in Message section.
Just to add, I generally do Ctrl + T and then execute so that we can see statistics output for each query along with query output.
very good article
just one question, the querytext shows the code that is CPU intensive how can we find out what proc is calling that code?
Its ID should come under object ID column.
Thanks Mr. Dave. I have question for you, how can I download these reports rdl files?
I am having 2 sql commands one command is execute 10 minutes at the time of cpu usage 30% only. While running second sql command this will complete within 5 minutes but the cpu taking 90% . At the time of taking report from sql server we take the report based on cpu time only. Based on cpu time means 10 minutes running query is available on report . But actual cause of the query is 5 minutes running query. How to retrieve this report