Note: This review is based on the performance monitoring and tuning free product Spotlight on SQL Server Freemium.
If you think of a DBA’s life, it has one very simple goal – their server should never go down and all the queries should always perform excellently. However, just like any other life goals o it is not possible to achieve that easily. I have often seen many DBA’s continuously watching their monitor to make sure that their servers are running fine. Another habit of most DBAs is to continuously check their mobile phone for alerts. Nowadays we get so many alerts it is getting harder to keep watch on the most important alerts for the health of our server. The habit of looking at the phone and computer monitor is so rooted into a DBA’s mind that they keep on looking at their phone at home to catch a suspicious alert.
Earlier this year, when I attended SQL PASS 2013, I stopped by the Dell Software booth to see what they have new in the SQL Server world. I noticed Spotlight on SQL Server Freemium running on their monitor. When I inquired about the price, I was happy, in fact I was very happy as it was totally FREE! After returning home, I got much too busy with my day job, but I recently I got some time and I downloaded the Spotlight on SQL Server Freemium FREE tool. The installation was pretty straight forward and easy. It took me less than 10 seconds for me to install the tool, just make sure that your SSMS is closed when you install Spotlight on SQL Server Freemium, otherwise it will show you a warning to turn off SSMS.
Once I installed the plug-in, it was very easy to use it as it becomes an integral part of the SQL Server Management Studio, the interface is a very user friendly.

There are three distinct options in the Spotlight on SQL Server Freemium tool bar menu. Once you click on Monitoring it will give three options. 1) Heatmap 2) Alarms 3) Connections. Let’s look at them very quickly over here.

1) Heatmap
If our server is down, we want to know right away, but if everything is smooth we do not want to keep on getting reminders about that. For that reason Heatmap is a very essential part of Spotlight on SQL Server Freemium. It gives an ‘at-a-glance’ picture of the state of all the servers DBAs have in their environment. Colors communicate all the information about what is going on with your server. The heatmap takes this a step further by displaying each server as a tile and then aggregating all of the statuses of a server and assigning a size to that tile. It also displays alarms for the connection when touched.

2) Alarms
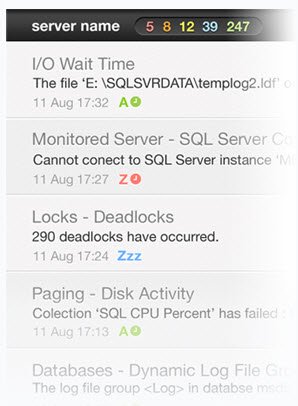
Alarms is just an alternate way to view Heatmaps. They display alarms on each server ordered by severity. You can configure and sort alarms the way you prefer. Once an alarm rings an experienced user can do either of two actions: a) Acknowledge the alarm and solve the issue b) Snoozing it to be reminded in the future.

3) Connections
This particular area displays various connections to diagnose a server as well as the server which you are monitoring. You can make various adjustments in your server connection in this section.
System Health Check
One of the biggest features of Spotlight on SQL Server Freemium is health check and providing a prioritized list of the key health system issues. Users can pinpoint various issues with the help of this list and resolve SQL Server issues. There are major five categories this tool checks: Security, Disaster Recovery, Index Optimization, Memory and SQL Best Practice.

In future blog posts we will cover each of these topics in depth. Meanwhile, I strongly suggest you download Spotlight on SQL Server Freemium and makes sure your servers are healthy. Additionally, visit www.SpotlightEssentials.com, the one-stop shop for all things Spotlight.
Reference: Pinal Dave (https://blog.sqlauthority.com)


3 Comments. Leave new
Thanks a lot. Will it impact any system performance as spotlight is continuously run.
Please confirm.
Regards,
PavanKumar Bolikonda