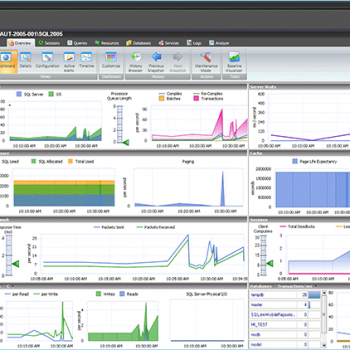
 In the fast-paced world of database administration, staying ahead of potential problems is key. SQL Server alerts serve as the early warning system, informing you of critical issues before they escalate. However, managing these alerts can sometimes feel like navigating a storm. In this post, we’ll explore the native solutions for setting and managing SQL Server alerts, and show how SQL Diagnostic Manager for SQL Server for SQL Server (SQL DM) provides a superior approach with its advanced, customizable alerting system, capable of targeted notifications and automated response actions. Let us explore more about SQL Server Alert Management.
The Challenge of SQL Server Alert Management
Alerts in SQL Server play a crucial role in proactive database management, helping to identify potential issues before they impact performance or availability. However, managing these alerts can be challenging. Native SQL Server tools can generate a high volume of alerts, many of which may not be relevant to your specific environment or priorities, leading to alert fatigue and potentially causing important alerts to be overlooked. This can have real-world business impacts, such as a critical alert being missed due to alert fatigue, leading to a preventable server downtime during peak business hours.
Built-in SQL Solutions
SQL Server provides a built-in SQL Server Agent that allows you to set alerts for specific events or performance conditions. You can configure it to send email notifications, run jobs, or execute responses when an alert is triggered.
However, this requires manual configuration for each alert, and managing these alerts can be complex and time-consuming. Moreover, it doesn’t provide the flexibility to customize alerts based on your specific needs or the ability to automate response actions in a sophisticated manner.
Configuring SQL Server Agent Alerts
Setting up alerts using SQL Server Agent involves several steps. First, you need to define an operator who will receive the alerts, such as a DBA or a support team. Next, you need to specify the conditions that will trigger the alert, such as a specific SQL Server event, a performance condition, or a WMI event. For each alert, you can specify a response like sending an email to the operator, running a job, or executing a command.
While this provides a good foundation for alert management, it can quickly become cumbersome as the number of alerts increases. For example, if you need to set up different alerts for different databases on the same server, or if you need to change the response for an alert, you need to manually modify each alert.
System Monitor and Performance Logs
Additional native tools like System Monitor and Performance Logs can also be used for managing SQL Server alerts. System Monitor allows you to monitor SQL Server performance in real-time and set alerts based on performance counters like memory, disk I/O, CPU usage, and query times.
Performance Logs collects and stores performance metrics over time into a database. This includes counters like batch requests/sec, log flushes/sec, cache hit ratio, and page life expectancy. By analyzing historical performance logs, you can set intelligent thresholds for alerts.
For example, you may decide to set a CPU usage alert at 80% threshold after analyzing past peak usage. Or set a page life expectancy alert below a baseline derived from historical trends. While useful, these tools have limitations. The alerts are basic and lack customization. They also lack advanced features like targeted notifications and automated response actions.
SQL Diagnostic Manager for SQL Server: A Superior Approach to Alert Management
SQL Diagnostic Manager offers an advanced, customizable alerting system that moves beyond the limitations of native SQL Server tools.
Customizable Alerts: SQL DM allows you to customize alerts based on your specific needs. You can set thresholds for different performance metrics and create alerts for specific databases, SQL Server instances, or even individual queries. This ensures that you receive relevant alerts that align with your priorities.
Targeted Notifications: SQL DM enables you to direct alerts to the right people at the right time. Alerts can be categorized by severity, and notifications can be sent to different individuals or teams based on the type and severity of the alert, ensuring that critical issues are quickly addressed.
Automated Response Actions: Perhaps one of the most powerful features of SQL DM is the ability to automate response actions. When an alert is triggered, SQL DM can automatically execute SQL scripts, kill processes, or even start jobs, helping to resolve issues quickly and efficiently.
Conclusion
Managing SQL Server alerts is a critical aspect of database administration, but it doesn’t have to be chaotic. While SQL Server’s native tools provide a basic mechanism for setting and managing alerts, SQL Diagnostic Manager offers a more sophisticated and customizable solution. With SQL DM, you can tailor your alert management process to your specific needs, ensuring you stay informed about critical issues without being overwhelmed by irrelevant alerts.
SQL Diagnostic Manager for SQL Server brings clarity to the chaos, empowering you to manage SQL Server alerts with ease and precision. This means less time spent on managing alerts, and more time focused on strategic tasks. This not only ensures a smoother and more efficient database operation, but also leads to better business outcomes as potential issues are promptly dealt with before they can have a significant impact.
Try a free, 14-day trial of SQL Diagnostic Manager for SQL Server.
Reference: Pinal Dave (https://blog.sqlauthority.com)


