Wait types are the most misread numbers in SQL Server. So I caused six of them on purpose, one at a time. I took a profile of each while it was happening.
The lab is one table of 2.5 million rows, about 1.15 gigabytes, on SQL Server 2025. Every figure below is the wait recorded for my own session while the workload ran, not a server total. Where a wait behaved differently from its reputation, I have said so rather than tidied it away.
Each section carries a profile card with the reading of that wait. The measurements stay in the text, where they can keep the conditions they were taken under.
One number to hold in your head before we start. A lock wait in this lab cost 81,927 milliseconds across a single wait. A processor wait in the same lab cost 3 milliseconds across 398 waits.
Sorted by count and sorted by time, a wait list gives you two different answers. Only one of them is about your problem.
1. PAGEIOLATCH_SH
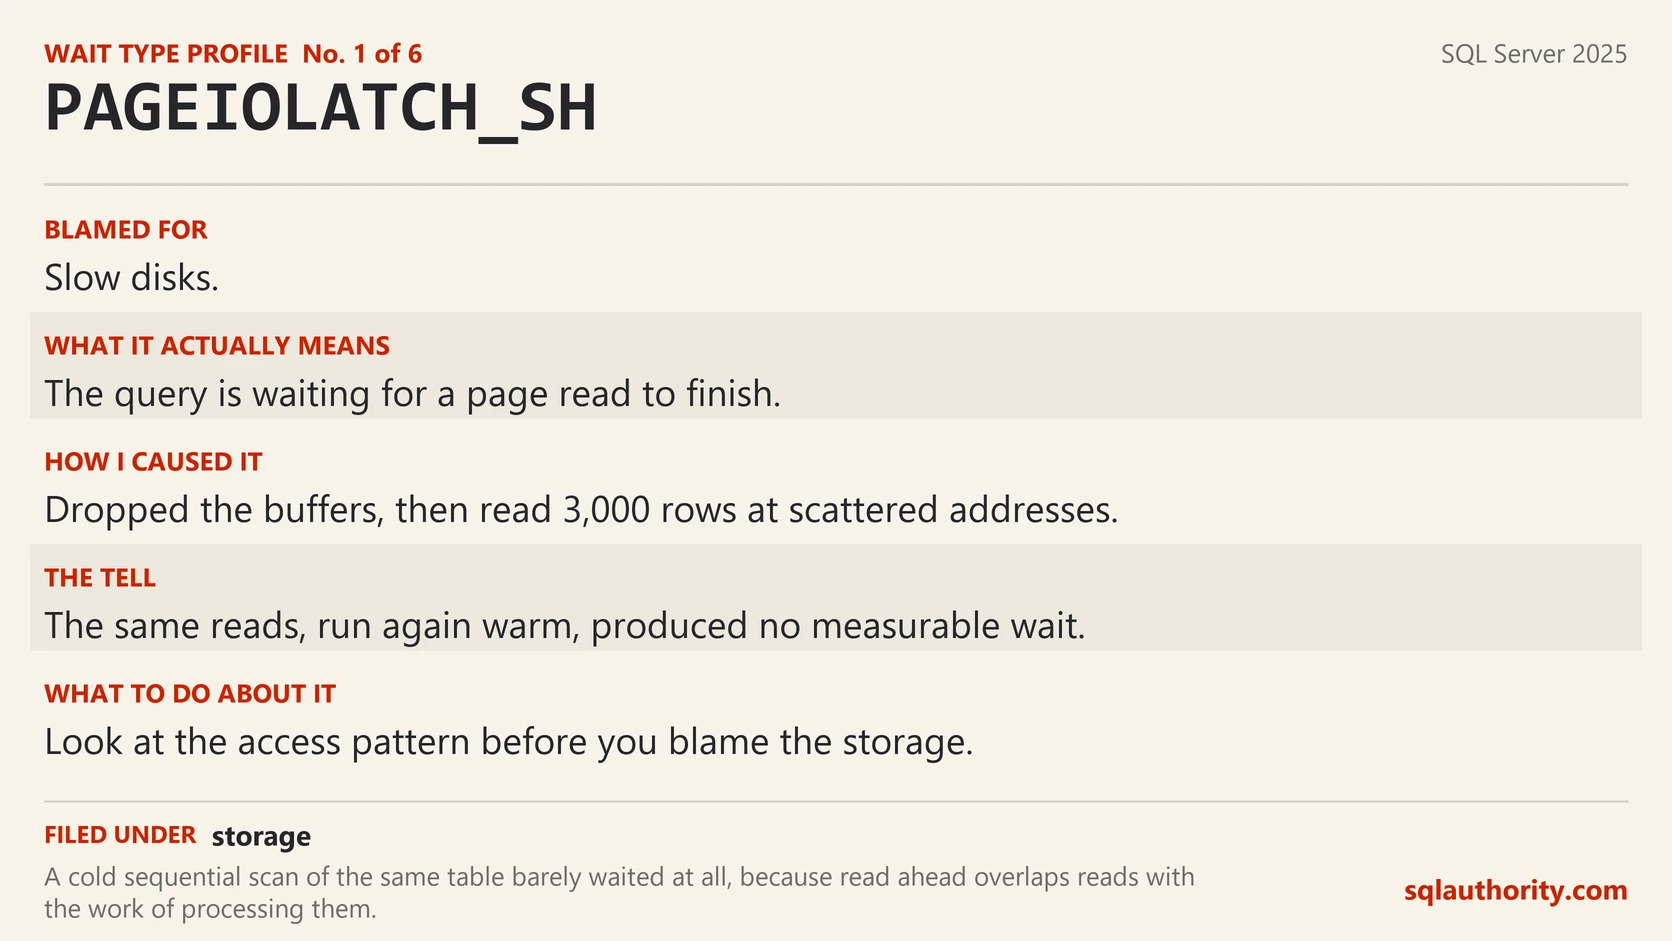
Blamed for: slow storage. Actually means: the query is waiting for a page read to finish.
I dropped the clean buffers, then read 3,000 rows at scattered addresses. That is the pattern read ahead cannot help with.
That produced 457 milliseconds of PAGEIOLATCH_SH across 2,453 waits, out of 590 milliseconds of elapsed time. Three quarters of that query was waiting for a disk.
I ran the identical 3,000 reads again immediately. Fifty one milliseconds, and no positive millisecond PAGEIOLATCH_SH entry at all.
That wording is deliberate. My filter only showed waits whose recorded time went up. A wait can be counted without adding a measurable millisecond.
Now the part that surprised me. A cold sequential scan of the whole 1.15 gigabyte table produced 7 milliseconds of PAGEIOLATCH_SH across 23 waits.
The scattered reads spent far more time waiting for page reads than the sequential scan did. Read ahead can overlap sequential reads with the work of processing them.
So this wait is not a storage report card. The access pattern matters as much as the storage under it.
2. ASYNC_NETWORK_IO
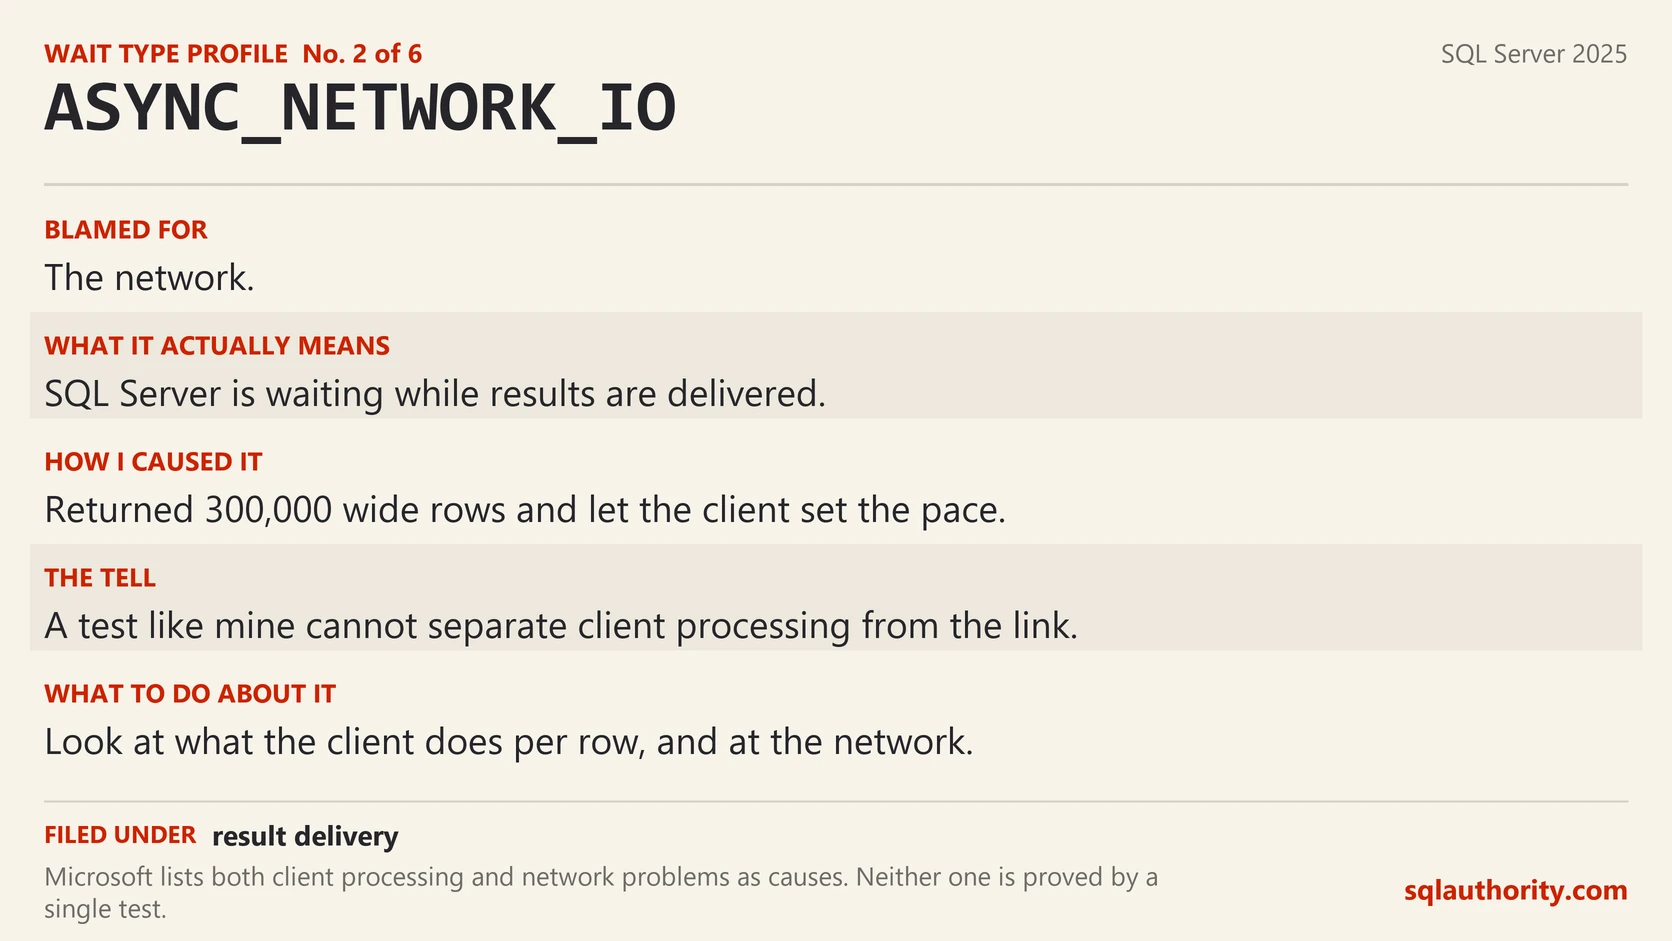
Blamed for: the network. Actually means: SQL Server is waiting during result delivery.
I sent 300,000 wide rows to a client and let the client be the slow part. The server logged 2,467 milliseconds of ASYNC_NETWORK_IO across 20,180 waits, from 3,363 milliseconds of elapsed time.
Nearly three quarters of that query was the server waiting for the receiver to catch up.
That is SQL Server waiting while results are delivered. This test does not separate client processing time from network limits, and it was never built to.
Microsoft lists both causes, client processing and the network itself. So look at what the application does with each row, and at the link, before picking a department to blame.
3. WRITELOG
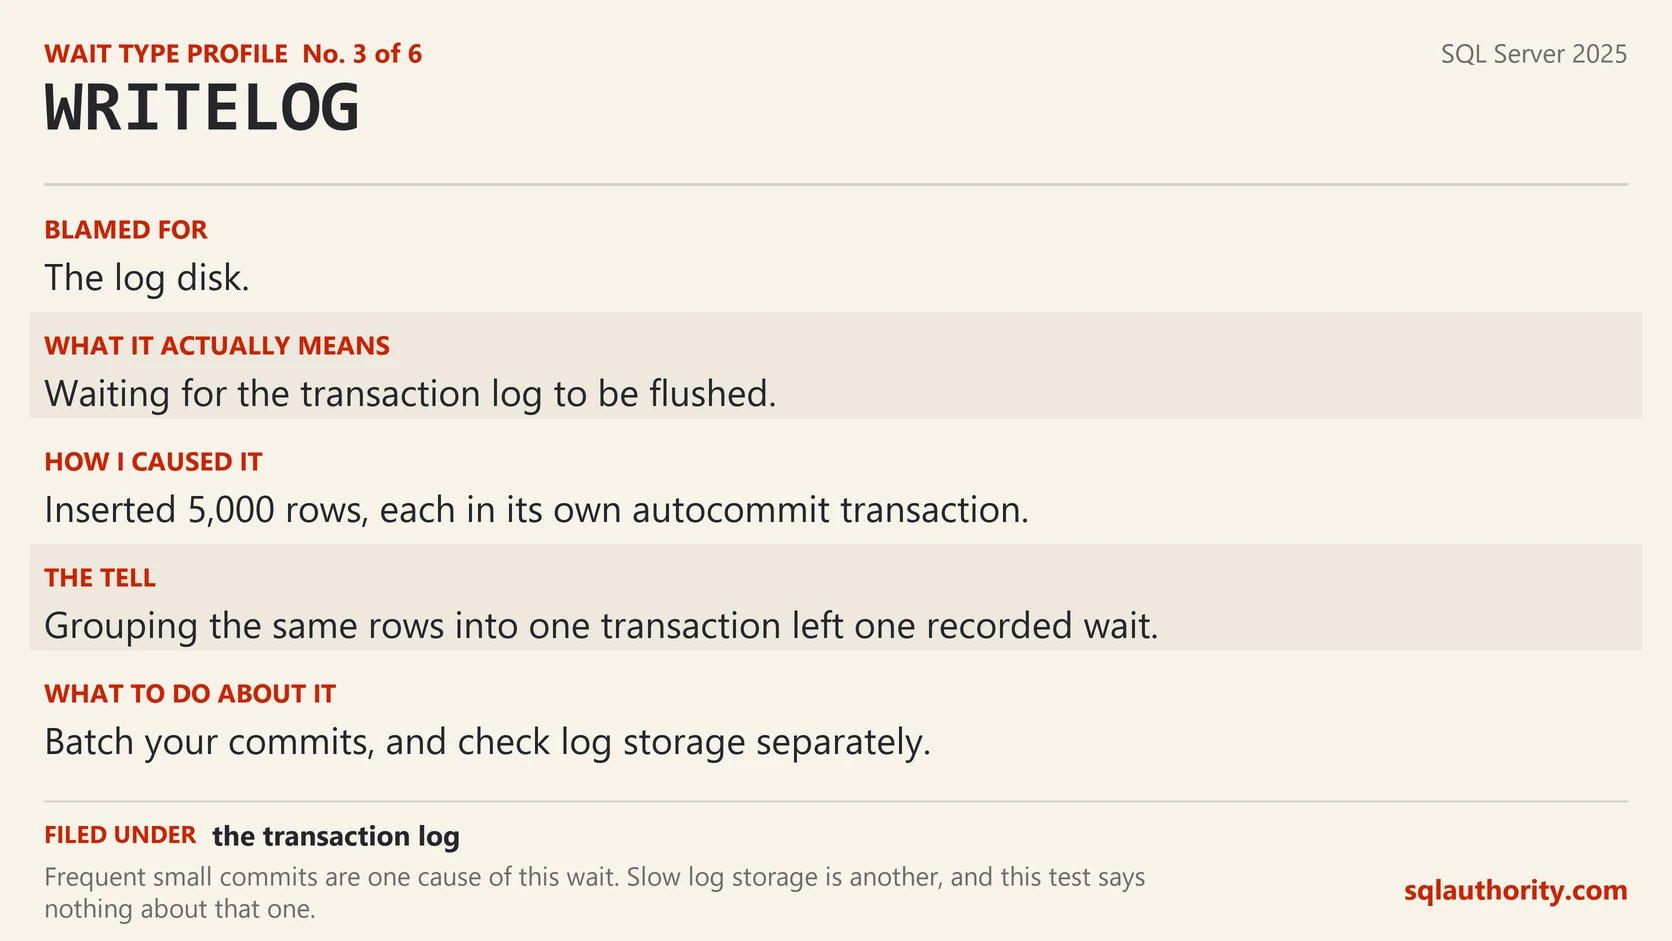
Blamed for: the log disk. Actually means: waiting for the transaction log to be flushed.
I inserted 5,000 rows one at a time, each in its own autocommit transaction. That produced 842 milliseconds of WRITELOG across exactly 5,000 waits, from 1,125 milliseconds of elapsed time.
The run recorded 5,000 WRITELOG waits for 5,000 individual commits. A wait count is not a count of physical flushes. Read it as one wait per commit, not one flush per commit.
Then I inserted the same 5,000 rows inside one transaction. Grouping them reduced it to a single recorded wait, one millisecond, and 130 milliseconds elapsed.
The disk did not change between those two runs. The number of times I asked for a promise did.
Frequent small commits are one cause of this wait. Slow log storage is another, and this test says nothing about that one.
4. LCK_M_IS
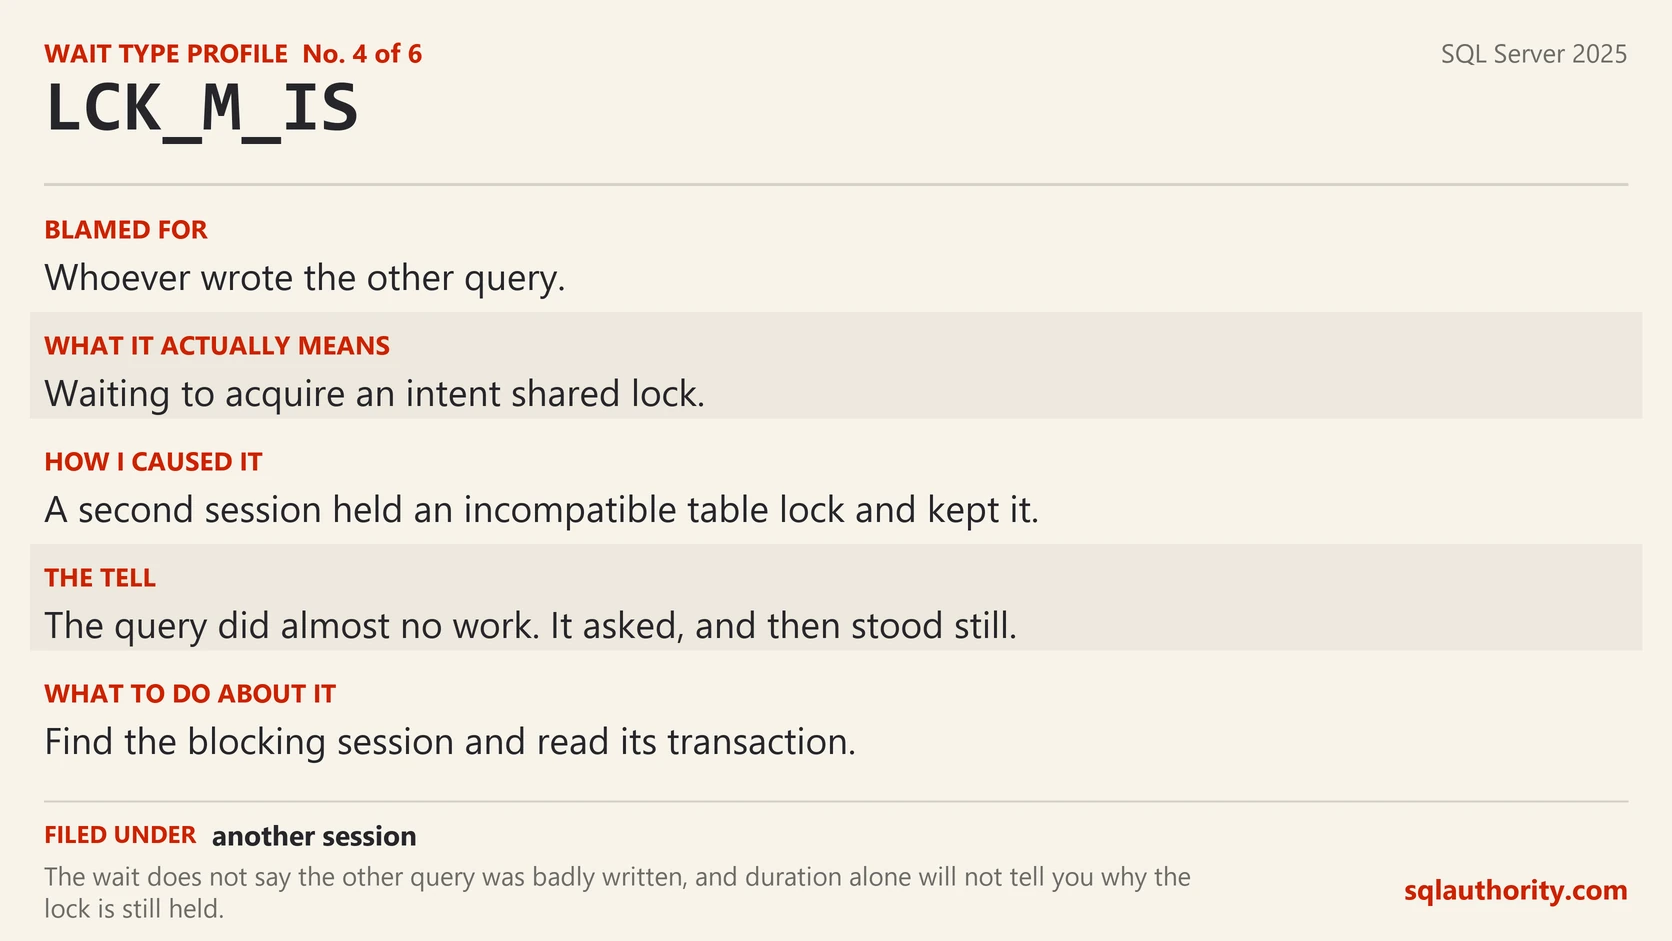
Blamed for: whoever wrote the other query. Actually means: this session was waiting to acquire an intent shared lock.
A second session took a table level exclusive lock and held it. Then I read a single row from the other session.
That read took 81,935 milliseconds, of which 81,927 were a single LCK_M_IS wait.
Read the shape of that, not the size. One wait. The query did almost no work, asked for permission, and stood still for a minute and a half.
Another session held an incompatible lock. That is all the wait tells you, and it does not say the other query was badly written.
I used a table lock so the wait would be unmistakable. A real application is usually holding a row, which makes the same point less reliably in a lab.
Nothing here was slow. Something was closed.
Duration alone will not tell you why the lock was still held either. Find the blocking session and look at its transaction.
5. SOS_SCHEDULER_YIELD
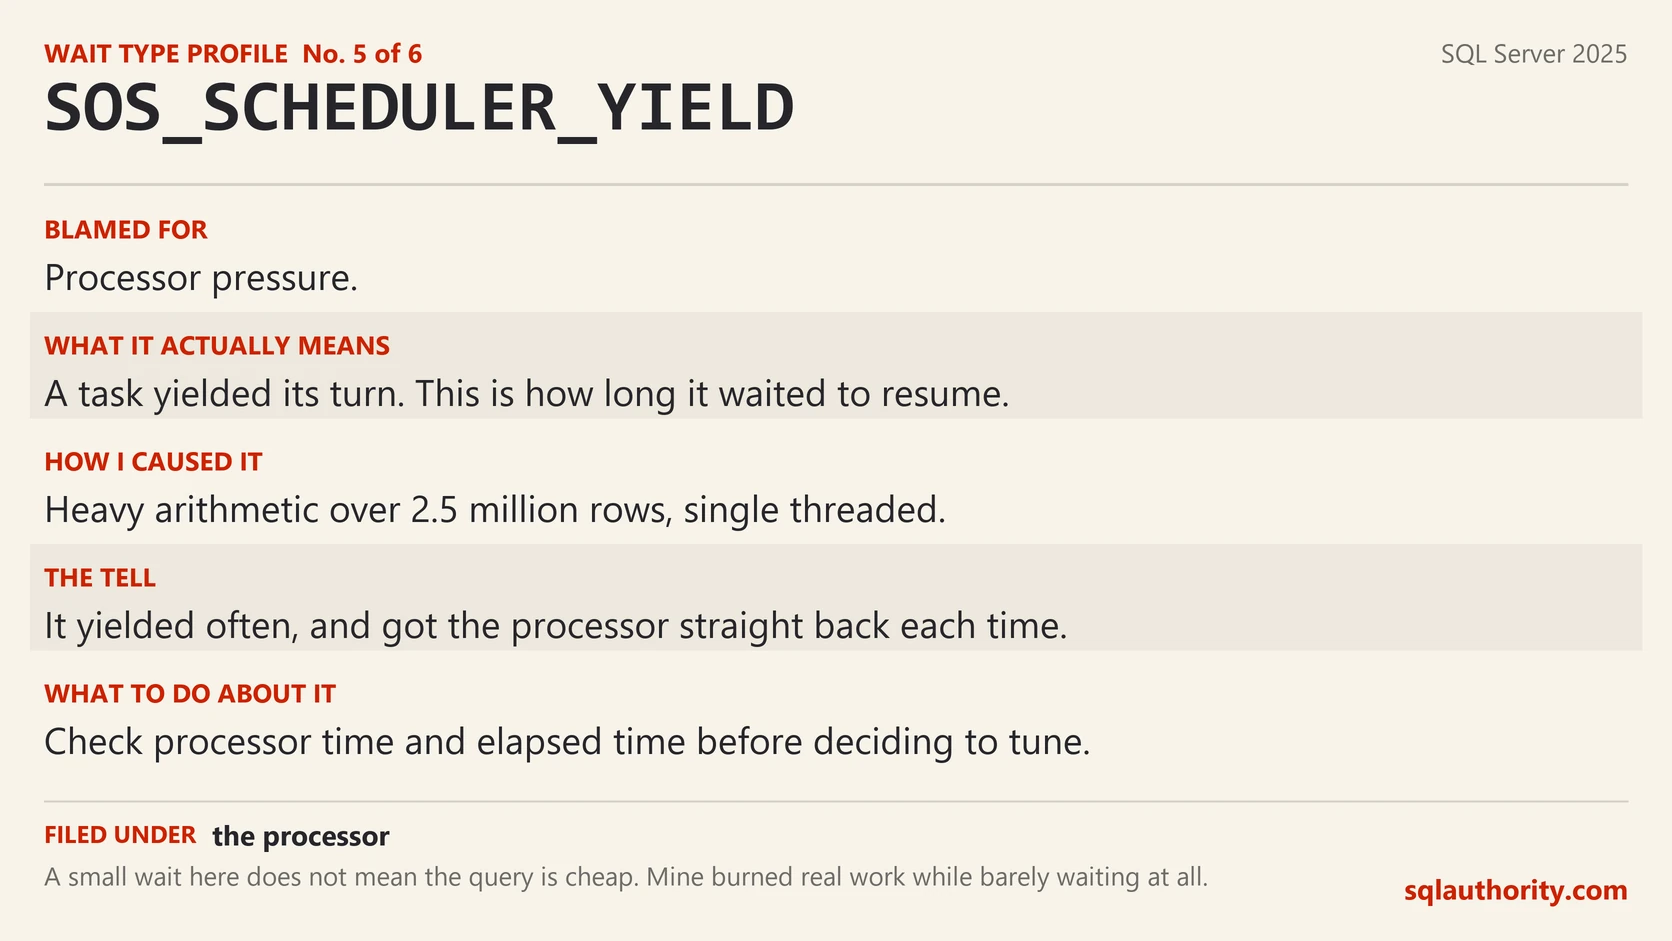
Blamed for: processor pressure. Actually means: a task yielded its turn, and this is how long it waited to resume.
I ran heavy arithmetic across all 2.5 million rows, single threaded, on a warm cache. It took 1,680 milliseconds of elapsed time.
The wait it recorded was 3 milliseconds across 398 waits.
SQL Server schedules co-operatively. A task that has used its turn yields and goes to the back of the queue. If nothing else wants the processor, it comes straight back. Each of those 398 yields cost a rounding error.
The query yielded 398 times and waited 3 milliseconds in total. It got the processor back quickly every time.
That is not permission to ignore the query. It burned 1,680 milliseconds of real work. Check processor time and elapsed time before deciding whether it needs tuning.
6. CXCONSUMER
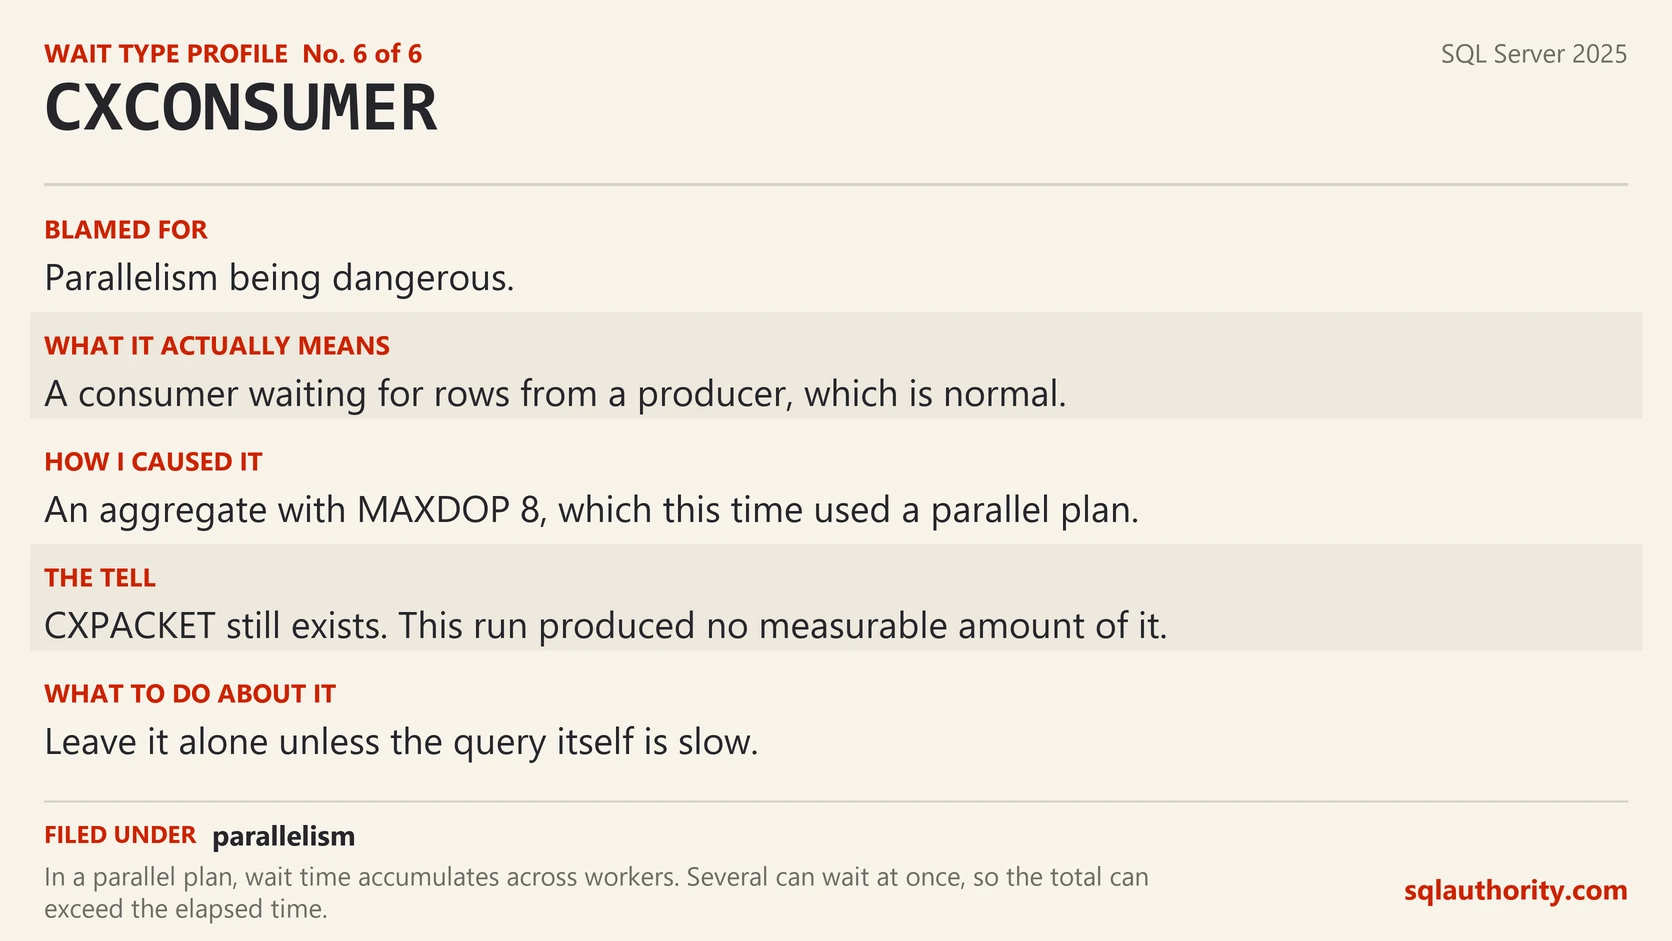
Blamed for: parallelism being dangerous. Actually means: a consumer thread waiting for rows from a producer, which is normal parallel execution.
I ran an aggregate over the whole table with MAXDOP 8, and this execution used a parallel plan. MAXDOP sets a ceiling rather than forcing parallelism.
It produced LATCH_EX at 529 milliseconds, and CXCONSUMER at 338 milliseconds across a single wait. CXSYNC_PORT added 43 more.
This run reported CXCONSUMER and CXSYNC_PORT, with no positive millisecond CXPACKET entry. CXPACKET still exists in SQL Server 2025 and this workload did not produce a measurable amount of it.
The elapsed time for that query was 357 milliseconds, and LATCH_EX alone recorded 529. That is not an error.
In a parallel query, wait time accumulates across workers. Several workers can be waiting at the same moment, so the total can exceed the elapsed time of the query.
So a percentage of the query is meaningless for a parallel plan. That is the one figure I will not give you here.
The one in every single test
MEMORY_ALLOCATION_EXT appeared in several of the workloads I ran. On the cold scan it recorded 119,175 waits, which sounds alarming until you look at the other column.
Ninety five milliseconds. That is 0.0008 milliseconds per wait.
It is the internal bookkeeping of handing out memory. It will sit at the top of any list you sort by count.
So start with total wait time. Then use the count and the average duration to read the pattern.
That is how you tell 398 cheap waits from one expensive one.
How to read your own
Server wide totals since the last restart are almost useless for a specific complaint. They tell you what the instance has done since March.
Watch one session instead, which is how every number above was taken.
-- run this in the session you are about to watch
SELECT * INTO #before FROM sys.dm_exec_session_wait_stats WHERE session_id = @@SPID;

-- now run the slow thing, in this same session

SELECT a.wait_type,
       a.wait_time_ms       - ISNULL(b.wait_time_ms, 0)       AS ms,
       a.waiting_tasks_count - ISNULL(b.waiting_tasks_count, 0) AS waits
FROM   sys.dm_exec_session_wait_stats a
LEFT JOIN #before b ON b.wait_type = a.wait_type
WHERE  a.session_id = @@SPID
  AND  (a.wait_time_ms        - ISNULL(b.wait_time_ms, 0)        > 0
    OR  a.waiting_tasks_count - ISNULL(b.waiting_tasks_count, 0) > 0)
ORDER BY ms DESC;
That filter catches a wait counted without a measurable millisecond. The version I used first would have hidden it.
On SQL Server 2022 and later you need VIEW SERVER PERFORMANCE STATE to read that view.
Sort by time. Then ask what the top entry means before you ask who to blame for it.
Sometimes a server has a wait list nobody can interpret. That is the kind of work I get called in for. You can see how I work with teams on my consulting page.
I write about numbers that look like answers in my book AI: Nobody’s in There. But we’re still in here. All thirty essays are free to read online, and the paperback is on Amazon.
A wait type is not a diagnosis, it is the name of the thing your query stood still for.
Published by Pinal Dave on SQLAuthority. More of my work at pinaldave.com.
Discover more from SQL Authority with Pinal Dave
Subscribe to get the latest posts sent to your email.