Long running queries in MySQL are easy to find once you know where the server keeps its notes. There are two good places: the slow query log and the Performance Schema. Both are built in.

Why Fast Queries Turn Slow
A new application starts with little data and simple rules. Queries run fast and nobody looks at them. Then the data grows and the business logic gets more complex. The same queries start to run slowly now and then. Data that was free to read is now locked by other work. Queries that sprinted begin to crawl.
Three words describe what happens, and they are easy to mix up. A lock is how InnoDB protects data while a transaction works on it. Blocking is what you see when one transaction waits for a lock that another holds. A deadlock is a circle of transactions that wait for each other. InnoDB detects a deadlock by itself and rolls one transaction back, so it needs no help from you.
A plain wait can hurt more. A transaction that waits too long for a row lock fails with error 1205. The wait limit is innodb_lock_wait_timeout, and the default is 50 seconds. Watching for long running queries in MySQL shows you these waits. The slow query log records a statement once it ends. It shows a wait that has already finished or failed. The table data_lock_waits shows a wait while it is happening.
Method 1: The Slow Query Log
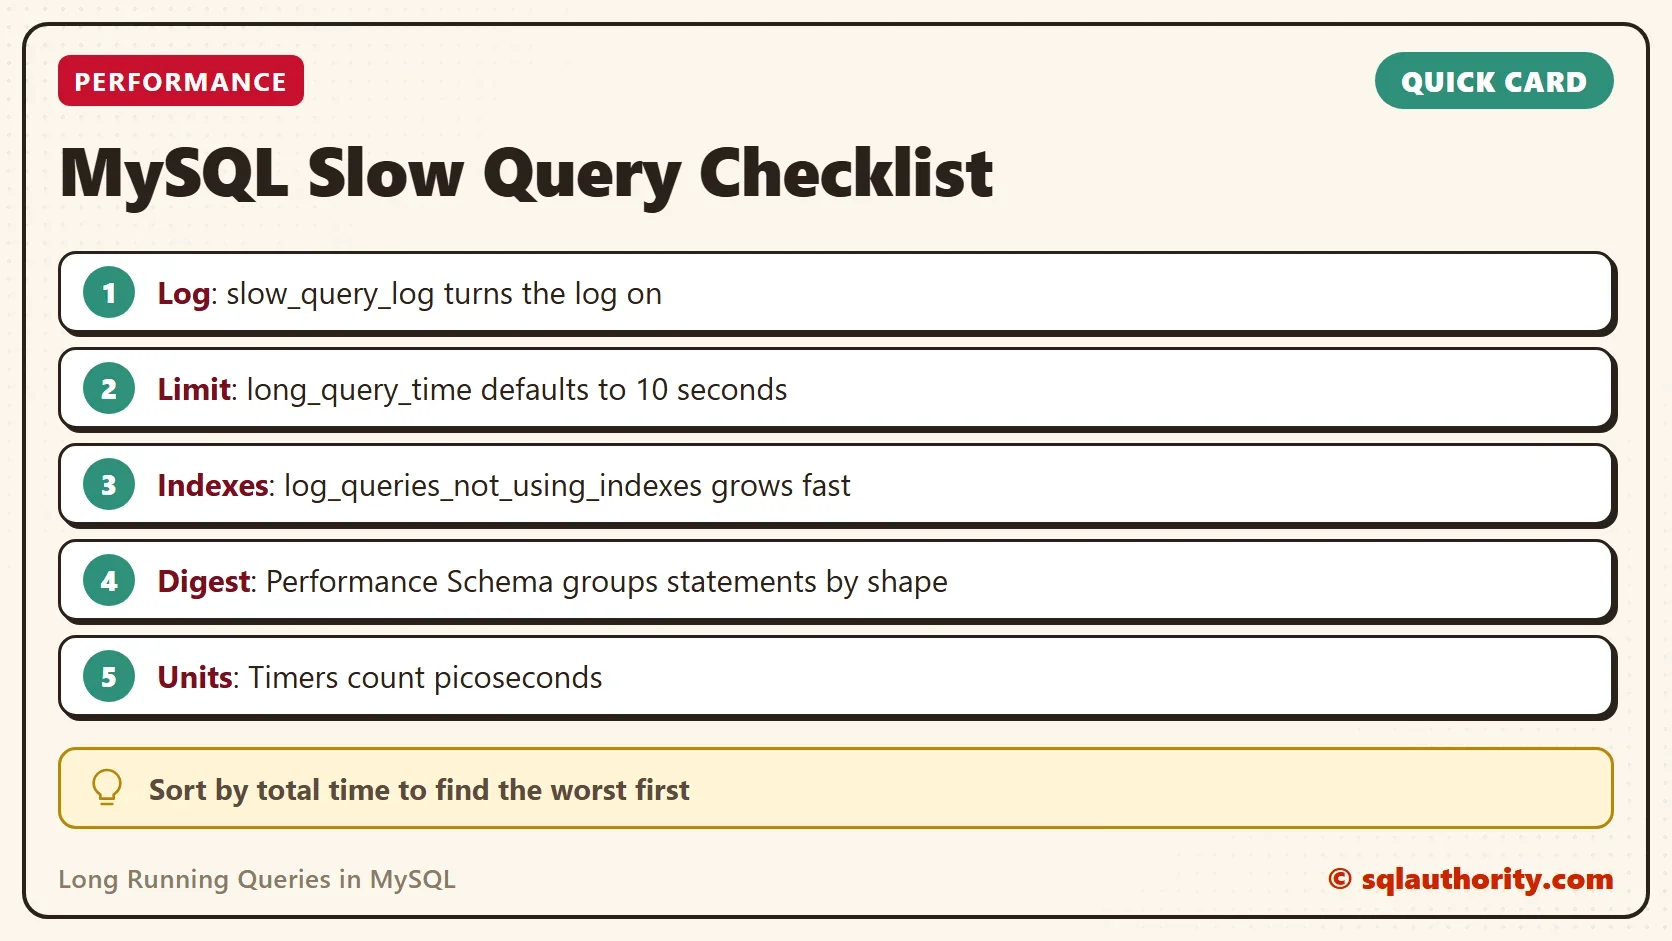
The slow query log records every statement that takes longer than a limit you choose. Three variables control it. slow_query_log turns it on. long_query_time is the limit in seconds, and the default is 10. It accepts fractions down to microseconds. log_queries_not_using_indexes also logs statements that read without an index, which can fill the log quickly.
You can set all three while the server runs, with no restart. A change made this way is lost at the next restart. To keep it, put the same settings in the option file. On Linux that is commonly /etc/mysql/my.cnf, and on Windows it is C:\ProgramData\MySQL\MySQL Server 8.0\my.ini. The exact path depends on the installation. The name of the log file comes from slow_query_log_file.
SET GLOBAL slow_query_log = 'ON';
SET GLOBAL long_query_time = 2;
SET GLOBAL log_queries_not_using_indexes = 'ON';
The example logs anything over two seconds, and anything that skips an index. Start with a higher limit on a busy server. Turn the index option off again after you have looked at the first results, because it logs a lot. The code above is MySQL, and it was not run here.
Method 2: The Performance Schema
The Performance Schema keeps its statistics in memory and groups statements by their shape, called a digest. One row covers every run of a statement, whatever its values. The table events_statements_summary_by_digest holds the run count and the total and average time. It also holds the lock time and the first and last time the statement was seen.
The timers are measured in picoseconds, so the query divides by one trillion to get seconds. Name the schema in the table, and sort by total time to see the worst statements first. A limit of ten keeps the list short.
SELECT SCHEMA_NAME, DIGEST_TEXT, COUNT_STAR,
       SUM_TIMER_WAIT / 1000000000000 AS SUM_TIMER_WAIT_SEC,
       AVG_TIMER_WAIT / 1000000000000 AS AVG_TIMER_WAIT_SEC,
       SUM_LOCK_TIME / 1000000000000 AS SUM_LOCK_TIME_SEC,
       FIRST_SEEN, LAST_SEEN
FROM performance_schema.events_statements_summary_by_digest
ORDER BY SUM_TIMER_WAIT DESC
LIMIT 10;
A statement with a high total and a small average runs many times. A statement with a high average runs slowly each time. Both deserve a look, for different reasons. The lock time column shows the waiting that the server accounts for as lock time. For the live picture of who waits for whom, the Performance Schema in MySQL 8.0 has the table data_lock_waits. The code above was not run here either.
Choose Between Them
The slow query log gives you the exact text and timing of each slow run. It sits in a file you can search and keep. The Performance Schema gives you totals and averages without a file. It also answers a question the log cannot: how much time one kind of statement costs overall. A fast statement that runs a million times can cost more than a slow one that runs twice.
Both methods look at one server. With several MySQL servers, comparing them by hand gets tiring. A monitoring tool such as SQL Diagnostic Manager for MySQL gathers these numbers from every server. It ties them to configuration changes.
Both methods look back at what already ran. For a quick look at the current picture, read the process list, which shows statements that are running right now. This is MySQL code, and it was not run here.
SELECT ID, USER, DB, TIME, STATE, LEFT(INFO, 80) AS QueryStart
FROM information_schema.PROCESSLIST
WHERE COMMAND <> 'Sleep' AND TIME > 30
ORDER BY TIME DESC;
You could argue that the slow query log is enough. For one server it is. Add the Performance Schema to learn which statement costs the most in total, not only which ones were slow once.
What to Remember
To find long running queries in MySQL, switch on the slow query log with a sensible limit. Then read the digest table sorted by total time. Keep the index option off unless you hunt for missing indexes. When row blocking is the suspect, read data_lock_waits. The lock time column counts table lock time and can stay near zero while rows wait.
A slow query is not a surprise, it is a note that nobody was reading.
Published by Pinal Dave on SQLAuthority. More of my work at pinaldave.com.
Discover more from SQL Authority with Pinal Dave
Subscribe to get the latest posts sent to your email.