To find the OS thread of a session, join sys.dm_os_tasks to sys.dm_os_threads on the worker address. The result pairs a SQL Server session ID with the thread ID that Windows knows. With that pair you can follow one session in Performance Monitor or in any tool that lists threads.

Why Map a Session to a Thread
SQL Server numbers sessions, and Windows numbers threads. The two numbers have no connection unless you build it. A Windows administrator who watches the SQL Server process sees thread IDs in Performance Monitor. A database administrator sees session IDs. In one health check, an IT administrator asked for this map. The Windows side of the team tracked threads.
For the OS thread of a session, two views hold what you need. The view sys.dm_os_tasks lists the tasks that are active right now. Each task carries a session ID and a worker address. The view sys.dm_os_threads lists the operating system threads. It carries the same worker address and the thread ID. Reading both needs VIEW SERVER STATE, which is VIEW SERVER PERFORMANCE STATE on SQL Server 2022 and later. Every query here only reads.
Find the OS Thread of a Session
The first query finds the OS thread of a session you control, your own. It joins on the worker address and filters on @@SPID. The column exec_context_id is 0 for the main task of a session. The column scheduler_id names the scheduler that runs the task.
SELECT t.session_id, t.exec_context_id, t.task_state, t.scheduler_id, th.os_thread_id
FROM sys.dm_os_tasks AS t
INNER JOIN sys.dm_os_threads AS th ON th.worker_address = t.worker_address
WHERE t.session_id = @@SPID;
The result is one row. The values below come from one run.
| session_id | exec_context_id | task_state | scheduler_id | os_thread_id |
|---|---|---|---|---|
| 112 | 0 | RUNNING | 8 | 7088 |
The task_state column shows RUNNING for a task on the processor. RUNNABLE means the task waits for its turn on the processor, and SUSPENDED means it waits for a resource. Your own session is RUNNING, because it is running this query.
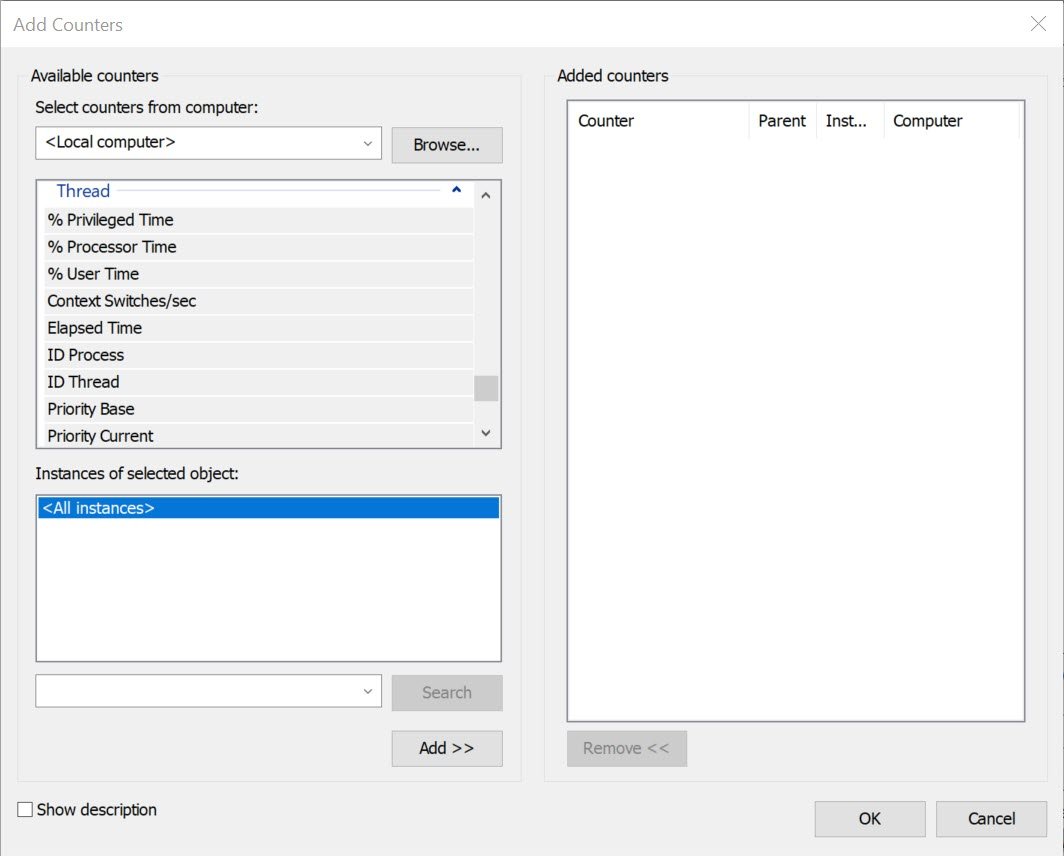
The thread ID is a decimal number. It is the number that Performance Monitor shows in its ID Thread counter. The session ID, scheduler and thread ID differ on your server, and the thread ID changes between runs. Only the layout is the same.
To see every user session with its login and status, add sys.dm_exec_sessions. The filter is_user_process = 1 removes the system sessions that SQL Server runs for itself.
SELECT s.session_id, s.login_name, s.status, t.exec_context_id, t.scheduler_id, th.os_thread_id
FROM sys.dm_exec_sessions AS s
INNER JOIN sys.dm_os_tasks AS t ON t.session_id = s.session_id
INNER JOIN sys.dm_os_threads AS th ON th.worker_address = t.worker_address
WHERE s.is_user_process = 1
ORDER BY s.session_id, t.exec_context_id;
The values differ on every server, so no output is shown.
What the Map Cannot Tell You
A session that is not running a request has no task. It does not appear in the result at all. In a test, a connection finished its query and sat idle. Its status was sleeping, and sys.dm_os_tasks returned no row for it. Only sessions that do work have a thread to map.
The pair is also a snapshot. SQL Server takes worker threads from a pool. The same session can run on a different thread in its next request. Run the query at the moment you need the answer. Do not store the result as a permanent link between a session and a thread.
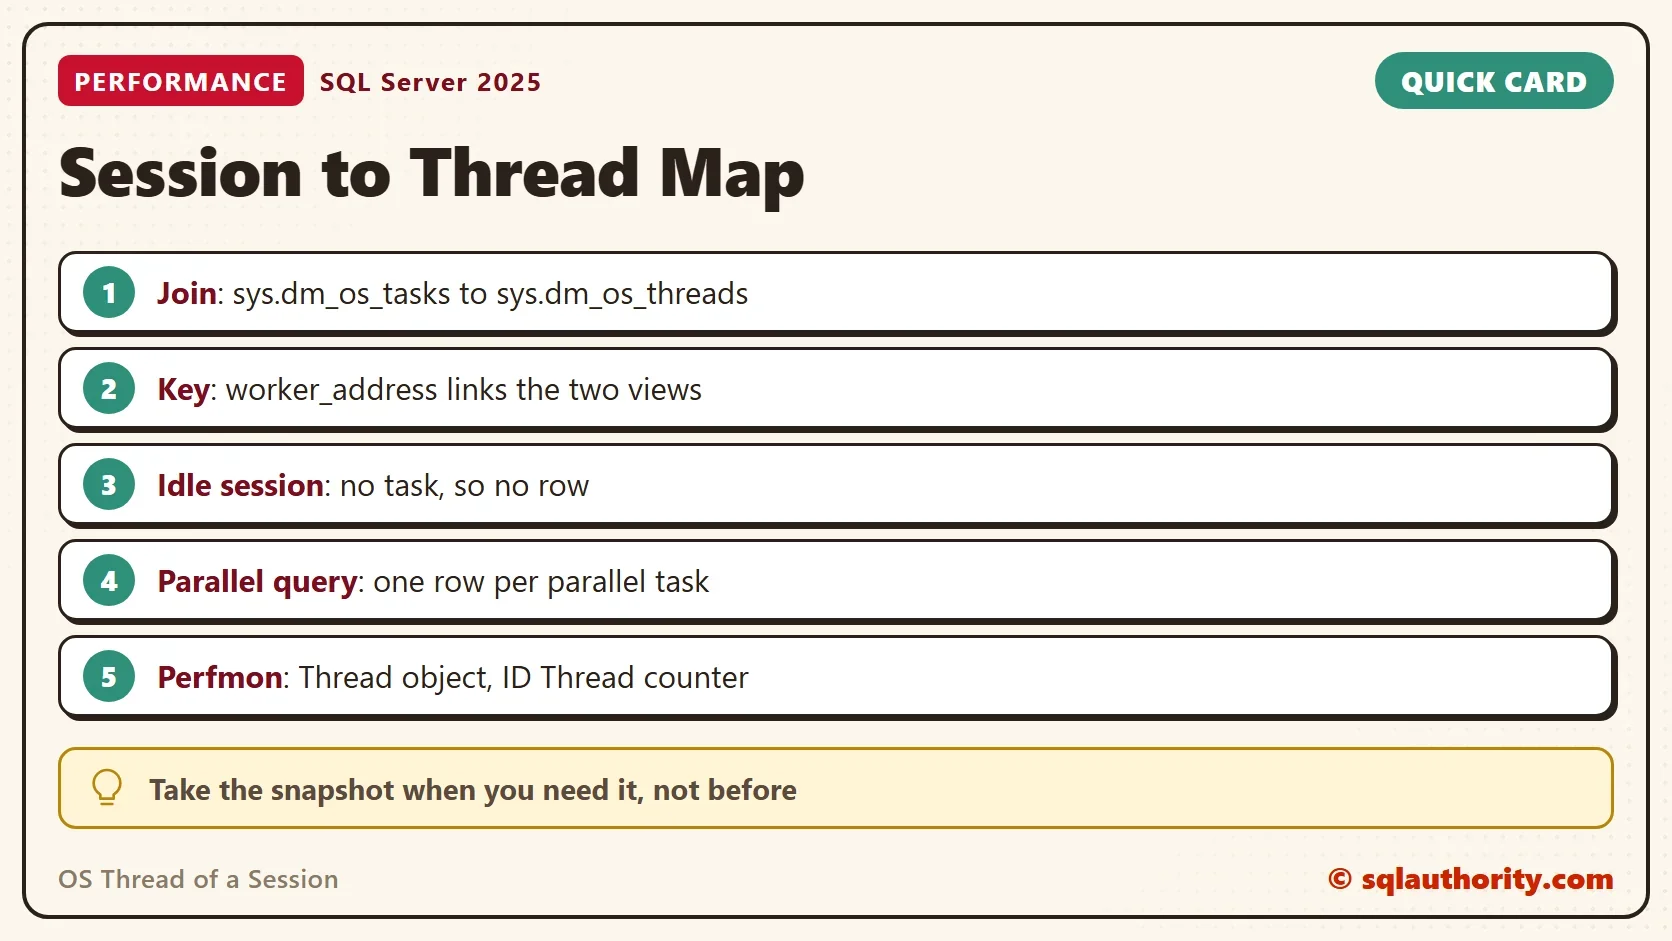
A parallel query adds rows. The documentation says each parallel task has its own row and thread, with exec_context_id above 0. To follow such a query, read every row of the session, not only the first.
Follow the Thread in Performance Monitor
Open Performance Monitor on the server and add counters. Choose the Thread object, select the counter named ID Thread, and pick the instances that belong to the sqlservr process. Each instance reports its thread ID. Find the instance that shows the number from your query. Then add the other Thread counters for it, such as the processor time. That gives you the Windows view of one session.
You could argue that this map is rarely needed. Wait statistics, request views and Extended Events describe a session in more detail. That is true. The map earns its place when the question comes from the operating system side. A Windows tool can show a thread with high processor time, and the question becomes which session owns it. For the scheduler side, read OS Threads by Scheduler in SQL Server: Count Them per CPU.
What to Remember
To find the OS thread of a session, join sys.dm_os_tasks to sys.dm_os_threads on worker_address. Filter by session, and read every row for a parallel query. Idle sessions have no row, and the pair changes from one request to the next. Take the snapshot when you need it.
A session ID is not a thread ID, it is a name for work that borrows one.
Published by Pinal Dave on SQLAuthority. More of my work at pinaldave.com.
Discover more from SQL Authority with Pinal Dave
Subscribe to get the latest posts sent to your email.