Live Query Statistics in SSMS draws a query plan that moves while the query runs. Each operator shows the rows it has produced so far, and a percentage beside them. That percentage is easy to misread, so I tested what it means on SQL Server 2025.

Turn It On
Three paths lead to Live Query Statistics in SSMS. In a query window, click the Include Live Query Statistics button on the toolbar. You can also choose Query, then Include Live Query Statistics. To watch a query in another session, open Activity Monitor, right-click the process and choose Show Live Execution Plan.
Run a query with the option on, and a new tab named Live Query Statistics appears beside Results and Messages. Dotted lines move between the operators while rows flow. A line turns solid when the operator below it has finished.
Here is my sixty second video on the feature.
A Query With a Wrong Guess
The percentages become interesting when an estimate is wrong, so the test query has a wrong estimate on purpose. It filters on a local variable. SQL Server cannot see the value inside a local variable at compile time. It guesses the average share of one status instead. A stored procedure parameter is different, because SQL Server reads its value on the first run.
The table has 10 million shipments and 20 different statuses. The average share is 5 percent, which is 500,000 rows. In truth, 9 million shipments are Delivered.
IF DB_ID(N'SqlLiveStatsDemo') IS NULL CREATE DATABASE SqlLiveStatsDemo;
GO
USE SqlLiveStatsDemo;
GO
DROP TABLE IF EXISTS dbo.Shipments;
DROP TABLE IF EXISTS dbo.Depots;
CREATE TABLE dbo.Depots (DepotID int PRIMARY KEY, Region varchar(10) NOT NULL);
CREATE TABLE dbo.Shipments
(
    ShipmentID int IDENTITY(1,1) PRIMARY KEY,
    DepotID int NOT NULL,
    Weight int NOT NULL,
    Status varchar(12) NOT NULL
);
INSERT INTO dbo.Depots (DepotID, Region)
SELECT s.value, CHOOSE(s.value % 4 + 1, 'North', 'South', 'East', 'West')
FROM GENERATE_SERIES(1, 200) AS s;
INSERT INTO dbo.Shipments (DepotID, Weight, Status)
SELECT s.value % 200 + 1, (s.value * 37) % 10007,
       CASE WHEN s.value % 10 <> 0 THEN 'Delivered' ELSE CONCAT('Status', s.value % 19) END
FROM GENERATE_SERIES(1, 10000000) AS s;
Now turn on Live Query Statistics and run the query. It ranks the shipments of each depot by weight and counts the top three per region.
DECLARE @Status varchar(12) = 'Delivered';
SELECT d.Region, COUNT_BIG(*) AS TopThree
FROM (SELECT s.DepotID, ROW_NUMBER() OVER (PARTITION BY s.DepotID ORDER BY s.Weight DESC, s.ShipmentID) AS rn
      FROM dbo.Shipments AS s WHERE s.Status = @Status) AS x
JOIN dbo.Depots AS d ON d.DepotID = x.DepotID
WHERE x.rn <= 3
GROUP BY d.Region
OPTION (MAXDOP 1);
The run took anywhere from 4 to 23 seconds on my shared test server. The live view reads from sys.dm_exec_query_profiles, so I polled that view from a second window to get exact numbers. Here are four moments from one run.
| Operator | Estimated rows | At 1.5 s | At 8.6 s | At 14.6 s | At 22.5 s |
|---|---|---|---|---|---|
| Clustered Index Scan | 500,000 | 1,611,900 | 9,000,000 | 9,000,000 | 9,000,000 |
| Sort (before the window) | 500,000 | 0 | 0 | 0 | 4,303,800 |
| Window Aggregate | 500,000 | 0 | 0 | 0 | 4,301,100 |
| Filter | 30 | 0 | 0 | 0 | 261 |
Reading the Percentages
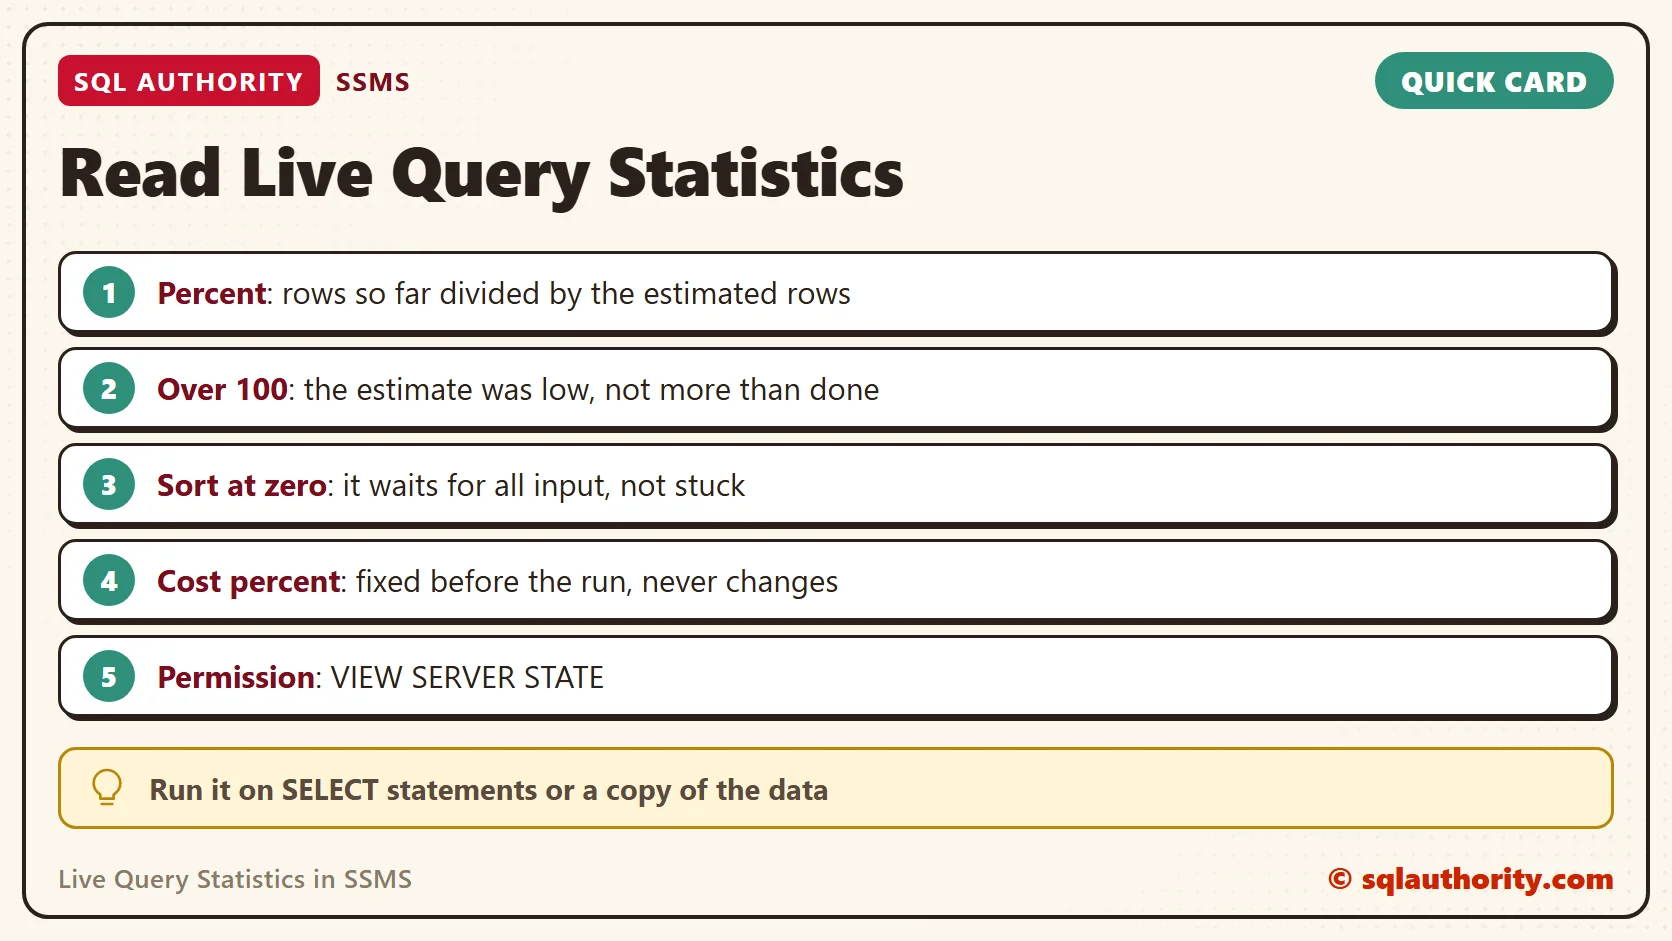
Under each operator, the live view shows a running time. It also shows the rows so far out of the estimated rows, with a percentage. The percentage is rows divided by the estimate. At 1.5 seconds, the scan stood at 1,611,900 of 500,000, which is 322 percent.
A percentage above 100 does not mean the operator is more than done. It means the estimate was low. The scan ended at 9,000,000 rows, which is 1,800 percent of its estimate. Treat a number like that as a finding, because it shows that the plan was built on a wrong guess.
Not every estimate was wrong. The small scan of the depots table expected 200 rows and returned 200, so it showed exactly 100 percent. Estimates that match give an honest meter. Look for those first.
The Sort tells the opposite story. It sat at zero rows in every snapshot until the last one, while its time column kept growing. A Sort cannot return a row until it has read all of its input. A zero on a Sort means waiting, not stuck. Check whether the scan below it has finished.
At 22.5 seconds the Sort began to deliver. It had returned 4,303,800 rows, and the operators above it jumped from zero to nearly the same count. Filter, which keeps only the top three per depot, had passed 261 rows.
Two Different Percentages
A normal plan also shows a percentage under each operator, labeled Cost. It is the operator’s share of the estimated cost. SQL Server fixes it before the query runs, and it never changes. The live percentage answers another question, which is how many of the expected rows have arrived.
In this test, the ordinary plan gave the scan 61 percent of the cost and the Sort 39 percent. The live run looked different. The scan finished after about 8 seconds, and the Sort worked for roughly 14 more. The estimate said the scan was the heavy part. The clock said the Sort was.
Both percentages can mislead when the estimate is wrong, because both start from it. The live view has one advantage. It shows the real row counts moving, so a wrong estimate becomes visible while you still have time to act.
What It Costs
Live Query Statistics in SSMS runs the query. A DELETE deletes rows, and a long report runs for its full length. Use it on SELECT statements, or on a copy of the data. Collecting the counters also slows the query, so it belongs in a test window and not in a production habit. You need the VIEW SERVER STATE permission.
You could say the picture is a toy, and the view gives the same numbers. Fair point. For a script or a log, query the view. The picture earns its place on a plan with many operators, where the stalled one stands out at a glance.
A Simple Rule
With Live Query Statistics in SSMS, watch three things. First, find the operator with the most rows and compare it with its estimate. Second, if a Sort or a hash shows zero while its time grows, look below it for the real work. Third, treat any percentage far above 100 as a bug in the estimate.
In this test, the fix is small. Add RECOMPILE to the OPTION list, so SQL Server sees the real value of the variable. The estimate then came out at 9,000,650 rows against 9,000,000 actual, and the plan changed its join.
When you finish testing, remove the example database.
USE master;
GO
ALTER DATABASE SqlLiveStatsDemo SET SINGLE_USER WITH ROLLBACK IMMEDIATE;
DROP DATABASE SqlLiveStatsDemo;
A live percentage is not a countdown timer, it is a comparison between the guess and the truth.
Published by Pinal Dave on SQLAuthority. More of my work at pinaldave.com.
Discover more from SQL Authority with Pinal Dave
Subscribe to get the latest posts sent to your email.