
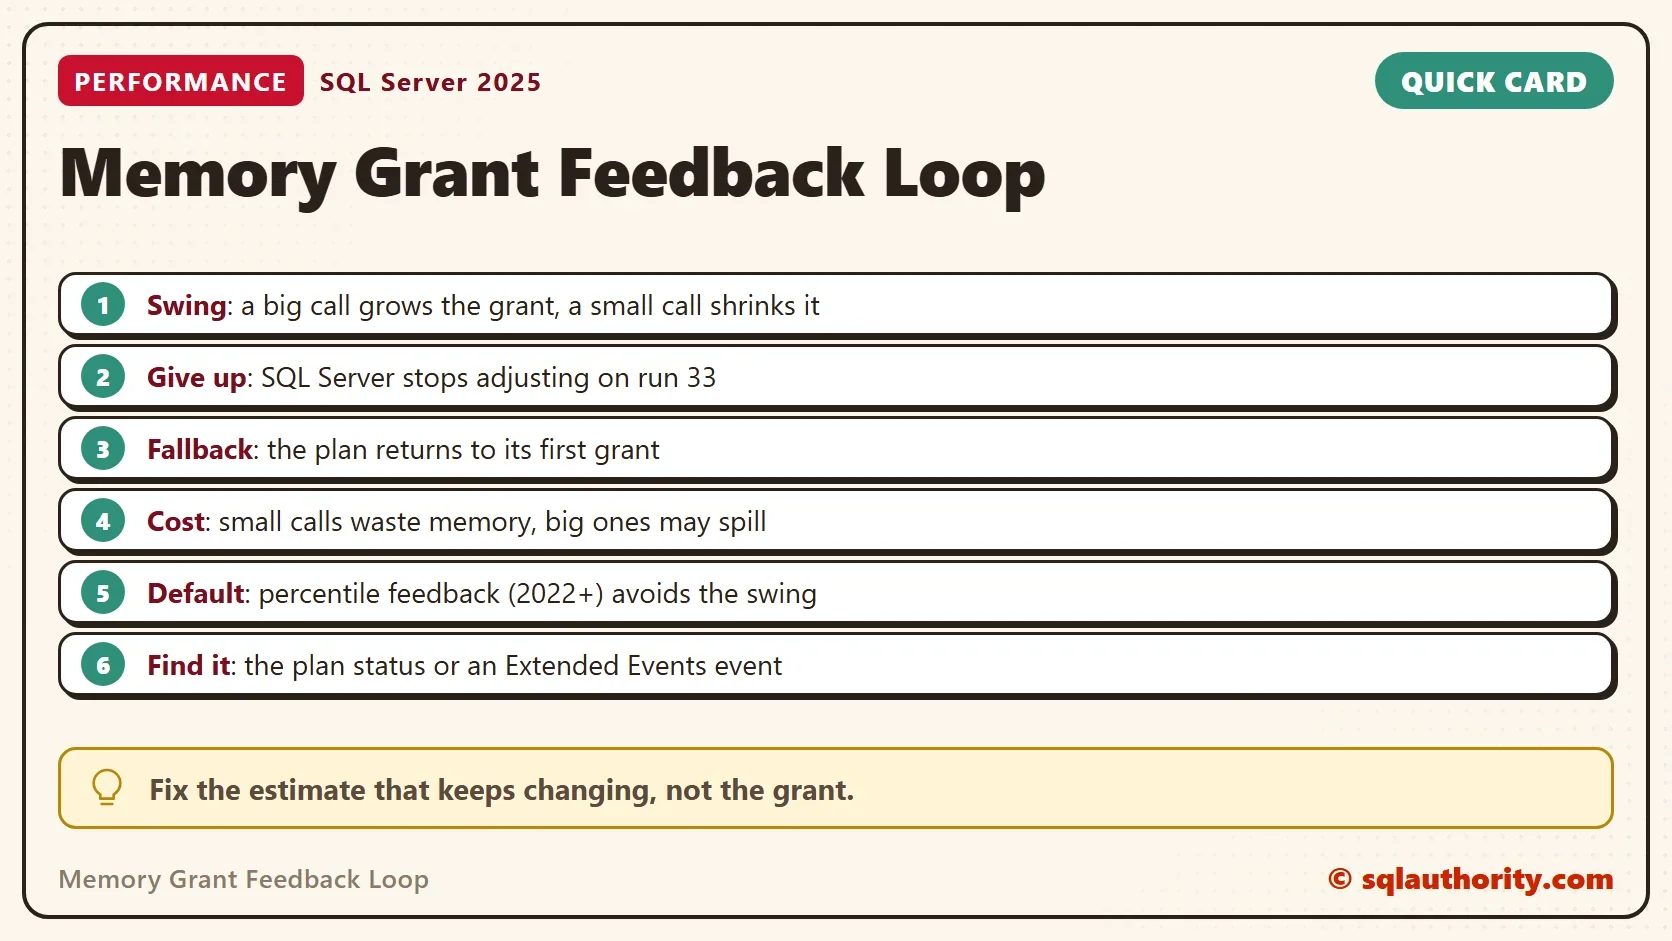
The memory grant feedback loop stops after repeated corrections. SQL Server then falls back to the first grant it gave the plan. A query whose memory needs swing between runs reaches that point. The demo below shows run 33 and the cost of the fallback.

Why a Loop Can Fail
Feedback adjusts a grant from the run before. A big call that used a lot of memory raises the grant. A small call that used little lowers it. A procedure that gets both kinds of call can chase its own tail. That is the memory grant feedback loop at work. The basics are in Memory Grant Feedback Explained: How SQL Server Learns.
The loop counts its changes and gives up when they don’t settle. It marks the plan as feedback disabled and goes back to the first grant. In this demo that happens on run 33. Runs 3 to 32 adjust the grant, and the plan gives up on run 33.
Build the Swing
The script creates a database named GrantLoopDemo with 200,000 orders. The procedure passes its parameter straight into the query, so the plan is built for the first value it sees.
IF DB_ID(N'GrantLoopDemo') IS NULL CREATE DATABASE GrantLoopDemo;
GO
USE GrantLoopDemo;
GO
DROP TABLE IF EXISTS dbo.Orders;
CREATE TABLE dbo.Orders (
    OrderID int IDENTITY(1,1) NOT NULL PRIMARY KEY,
    Remarks varchar(200) NOT NULL
);
INSERT INTO dbo.Orders (Remarks)
SELECT REPLICATE(CONVERT(varchar(36), NEWID()), 3)
FROM GENERATE_SERIES(1, 200000) AS s;
CREATE OR ALTER PROCEDURE dbo.OrdersSwing @MinID int AS SELECT OrderID, Remarks FROM dbo.Orders WHERE OrderID > @MinID ORDER BY Remarks;
Switch the Modern Settings Off
SQL Server 2022 added percentile and persistent feedback to calm this kind of swing. They are database settings, and a new database has both on. To watch the classic loop, the next script turns both off in the demo database only. The cleanup at the end turns them back on.
ALTER DATABASE SCOPED CONFIGURATION SET MEMORY_GRANT_FEEDBACK_PERCENTILE_GRANT = OFF;
ALTER DATABASE SCOPED CONFIGURATION SET MEMORY_GRANT_FEEDBACK_PERSISTENCE = OFF;
ALTER DATABASE SCOPED CONFIGURATION CLEAR PROCEDURE_CACHE;
Forty Calls and One Log
The script below calls the procedure forty times, alternating the big call and the small call. After each call it logs the grant, the memory used and the pages spilled from sys.dm_exec_query_stats. The grid shows runs 1 to 6 and 31 to 36.
DROP TABLE IF EXISTS #sink, #log;
CREATE TABLE #sink (OrderID int, Remarks varchar(200));
CREATE TABLE #log (Run int IDENTITY(1,1), Call varchar(5), GrantedKB bigint, UsedKB bigint, Spills bigint);
GO
DECLARE @i int = 1, @min int;
WHILE @i <= 40
BEGIN
    SET @min = CASE WHEN @i % 2 = 1 THEN 0 ELSE 199000 END;
    TRUNCATE TABLE #sink;
    INSERT #sink EXEC dbo.OrdersSwing @MinID = @min;
    INSERT #log (Call, GrantedKB, UsedKB, Spills)
    SELECT CASE WHEN @min = 0 THEN 'Big' ELSE 'Small' END,
           qs.last_grant_kb, qs.last_used_grant_kb, qs.last_spills
    FROM sys.dm_exec_query_stats AS qs
    CROSS APPLY sys.dm_exec_sql_text(qs.sql_handle) AS st
    WHERE st.dbid = DB_ID()
      AND st.objectid = OBJECT_ID(N'dbo.OrdersSwing')
      AND qs.max_grant_kb > 0;
    SET @i += 1;
END;
SELECT Run, Call, GrantedKB, UsedKB, Spills
FROM #log
WHERE Run <= 6 OR Run BETWEEN 31 AND 36
ORDER BY Run;| Run | Call | GrantedKB | UsedKB | Spills |
|---|---|---|---|---|
| 1 | Big | 42944 | 31384 | 0 |
| 2 | Small | 42944 | 160 | 0 |
| 3 | Big | 1536 | 1536 | 4351 |
| 4 | Small | 54264 | 160 | 0 |
| 5 | Big | 1536 | 1536 | 4359 |
| 6 | Small | 54360 | 160 | 0 |
| 31 | Big | 1536 | 1536 | 4359 |
| 32 | Small | 54360 | 160 | 0 |
| 33 | Big | 42944 | 31384 | 0 |
| 34 | Small | 42944 | 160 | 0 |
| 35 | Big | 42944 | 31384 | 0 |
| 36 | Small | 42944 | 160 | 0 |
Run three is the first correction. The small call in run two showed that the grant was too big. So the big call in run three got only 1,536 KB. It used all of it and spilled. Run four then got 54,264 KB for a call that needed 160 KB.
That swing repeats until run 33. From there every call gets 42,944 KB, the same grant as run one. The plan property reads No: Feedback Disabled, as the post on IsMemoryGrantFeedbackAdjusted Values: What Each Status Means describes.
A second query summarizes the log. It shows the smallest and largest grant for each call and how many runs spilled.
SELECT Call, MIN(GrantedKB) AS MinGrantedKB, MAX(GrantedKB) AS MaxGrantedKB,
       SUM(CASE WHEN Spills > 0 THEN 1 ELSE 0 END) AS SpilledRuns
FROM #log
GROUP BY Call
ORDER BY Call;| Call | MinGrantedKB | MaxGrantedKB | SpilledRuns |
|---|---|---|---|
| Big | 1536 | 42944 | 15 |
| Small | 42944 | 54360 | 0 |
Spill counts and some grants move by a few units from run to run. The pattern does not.
What the Fallback Costs
In this demo the fallback is kind to the big call. The first grant was sized for it, so the spills stopped on the test server. A second server still spilled a few hundred pages on some big calls after run 33. Read last_spills before you relax. The small call keeps 42,944 KB for 160 KB of use, about 270 times too much.
The fallback grant is the first grant of the plan, the compile time grant. Here the first run was the big call. A plan that meets the small call first starts with a small grant. In a test with the small call first, the grant stayed at 1,024 KB and all 20 big calls spilled.
What SQL Server 2025 Does by Default
The memory grant feedback loop looks different on a current default. Turn the settings back on, clear the plans, and run the log script and the summary query again. The percentile setting keeps a history of the memory used. It sizes the grant to cover the big call without giving up.
ALTER DATABASE SCOPED CONFIGURATION SET MEMORY_GRANT_FEEDBACK_PERCENTILE_GRANT = ON;
ALTER DATABASE SCOPED CONFIGURATION SET MEMORY_GRANT_FEEDBACK_PERSISTENCE = ON;
ALTER DATABASE SCOPED CONFIGURATION CLEAR PROCEDURE_CACHE;
| Call | MinGrantedKB | MaxGrantedKB | SpilledRuns |
|---|---|---|---|
| Big | 1536 | 47968 | 10 |
| Small | 6824 | 48288 | 0 |
10 of the 20 big calls spilled while the plan learned. From run 31 on, every call got about 44,000 to 46,000 KB, and nothing spilled. The status never turned to disabled in forty runs.
What to Check When a Plan Gives Up
Start with the estimate. A skewed parameter, a stale statistic or a local variable can mislead the estimate. It then fits one call and misses the other. Compare the estimated and actual rows for both calls in the plan. A large gap is the cause.
Then decide. You can split the work into two procedures, one for each size of call. You can add OPTION (RECOMPILE), which builds a plan for every call, so each call gets its own grant. Or you can accept the fallback, as the first demo did.
Is Giving Up Wrong?
You could argue that giving up is the safe choice. In the first demo it mostly was. But safe is not tuned. A plan that keeps 42,944 KB for a 160 KB call wastes memory that other queries could use.
What to Remember
A swinging parameter makes the memory grant feedback loop swing. Percentile feedback in SQL Server 2022 and later handles that better. So a disabled status on a new server is worth a look, because it means the estimate is unstable.
I check the plan status first, then the first grant, then the estimate. The post on Memory Grant Feedback Events: Capture Them in T-SQL shows how to catch the event as it happens. When you finish, run the cleanup.
USE GrantLoopDemo;
GO
ALTER DATABASE SCOPED CONFIGURATION SET MEMORY_GRANT_FEEDBACK_PERCENTILE_GRANT = ON;
ALTER DATABASE SCOPED CONFIGURATION SET MEMORY_GRANT_FEEDBACK_PERSISTENCE = ON;
GO
USE master;
GO
IF DB_ID(N'GrantLoopDemo') IS NOT NULL
BEGIN
    ALTER DATABASE GrantLoopDemo SET SINGLE_USER WITH ROLLBACK IMMEDIATE;
    DROP DATABASE GrantLoopDemo;
END;
A feedback loop is not a failure, it is a signal that the estimate keeps changing.
Published by Pinal Dave on SQLAuthority. More of my work at pinaldave.com.
Discover more from SQL Authority with Pinal Dave
Subscribe to get the latest posts sent to your email.



2 Comments. Leave new
How does “Nofeedbackdisabled” affects the performance ? Appreciate if you can shed some light on it ?
I will have to write another blog post for it.