
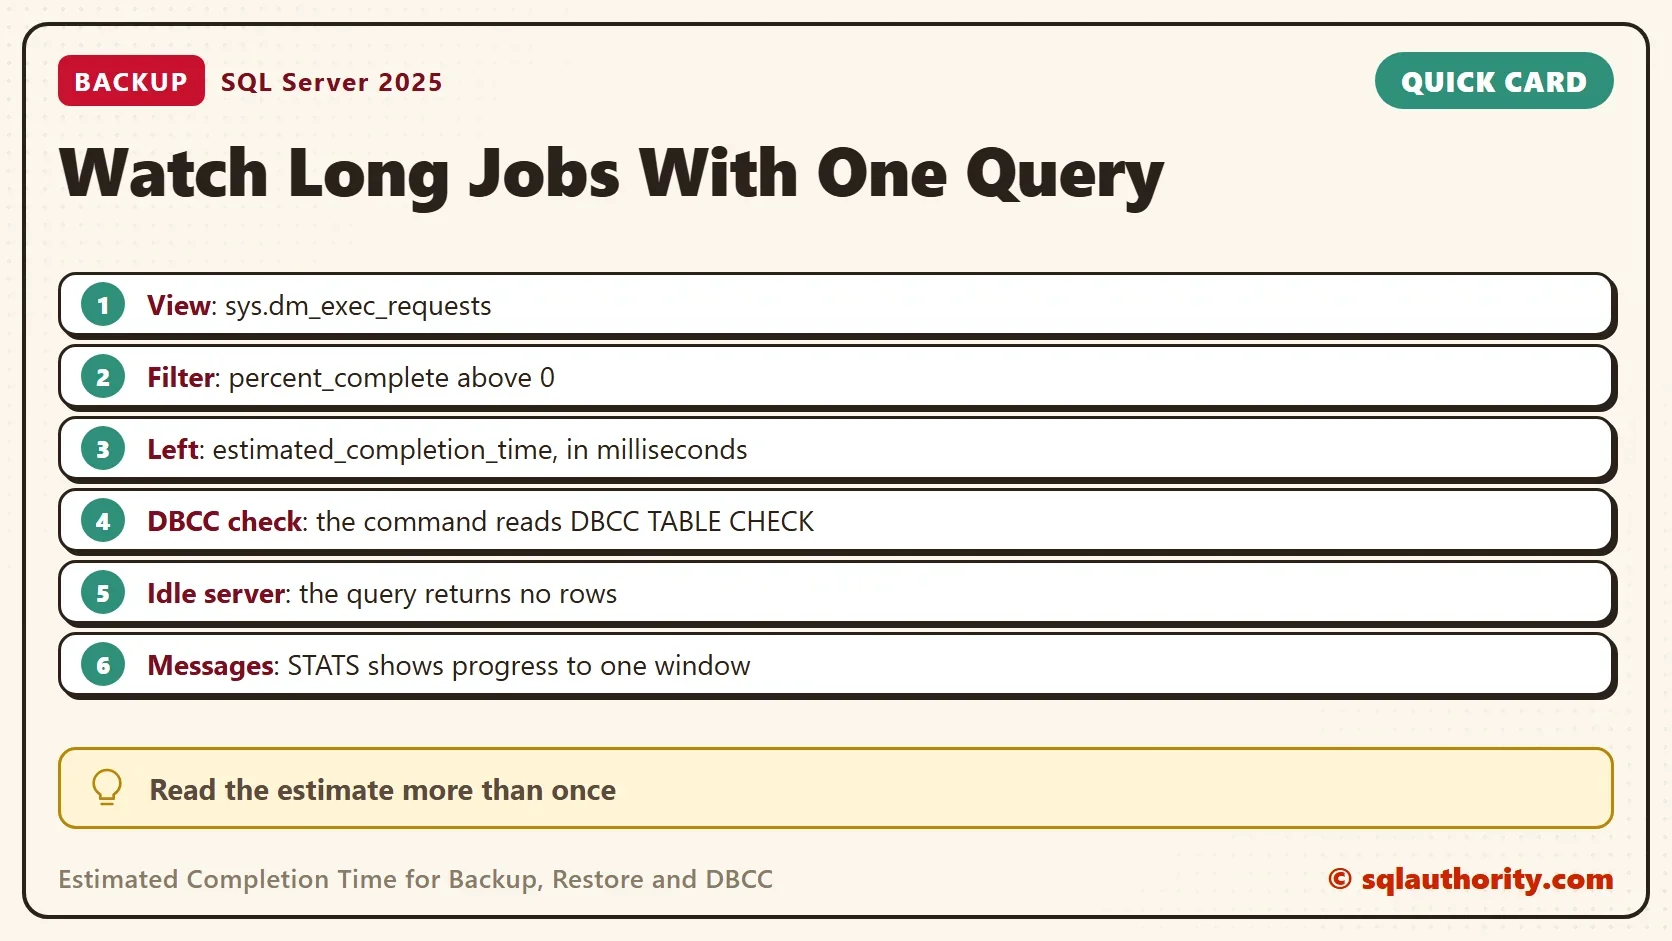
The estimated completion time of a backup, restore or DBCC command is one query away. SQL Server tracks the progress of long operations, and one view shows the percent done for every running request. The query below reads it, and three real jobs show it at work.

Which Operations Report Progress
The view sys.dm_exec_requests has two columns for this, percent_complete and estimated_completion_time. The second one counts milliseconds. Together they give the estimated completion time of a running command. SQL Server fills them in for a fixed list of commands. Backups, restores, DBCC checks, shrinks, index reorganizations and rollbacks are on the list. Most other commands stay at 0.
The query below doesn’t name any commands. It asks for every request whose percent is above 0. A new command that reports progress shows up without any change, and you never maintain a list. The filter session_id <> @@SPID hides your own query.
Build a Demo Database
The demo needs a database big enough to keep a backup busy for a few seconds. This script creates ProgressDemo with one table of about 1.7 GB. The log grows by about as much again, so check that your test drive has the space.
IF DB_ID(N'ProgressDemo') IS NULL CREATE DATABASE ProgressDemo;
GO
ALTER DATABASE ProgressDemo SET RECOVERY SIMPLE;
GO
USE ProgressDemo;
GO
DROP TABLE IF EXISTS dbo.Payloads;
CREATE TABLE dbo.Payloads (PayloadID int NOT NULL PRIMARY KEY, Body char(1000) NOT NULL);
INSERT INTO dbo.Payloads (PayloadID, Body)
SELECT TOP (1500000) ROW_NUMBER() OVER (ORDER BY (SELECT NULL)), REPLICATE('x', 1000)
FROM sys.all_objects AS a CROSS JOIN sys.all_objects AS b CROSS JOIN sys.all_objects AS c;
The Monitor Query
Open a second query window for this one. The idea for this kind of monitoring query comes from SQL Server expert Dominic Wirth. It shows the session, the operation, the database, the percent done, the time spent and the time left. The ExpectedFinish column adds the time left to the clock. You see a finish time, not only a number. The Statement column shows the start of the command text, which tells you who or what started the job.
SELECT r.session_id AS SessionId,
       r.command AS Operation,
       DB_NAME(r.database_id) AS DatabaseName,
       CAST(r.percent_complete AS decimal(5,1)) AS PercentDone,
       r.total_elapsed_time / 1000 AS ElapsedSeconds,
       r.estimated_completion_time / 1000 AS SecondsLeft,
       DATEADD(SECOND, CAST(r.estimated_completion_time / 1000 AS int), SYSDATETIME()) AS ExpectedFinish,
       LEFT(t.text, 60) AS Statement,
       r.wait_type AS WaitType
FROM sys.dm_exec_requests AS r
CROSS APPLY sys.dm_exec_sql_text(r.sql_handle) AS t
WHERE r.percent_complete > 0 AND r.session_id <> @@SPID
ORDER BY r.estimated_completion_time DESC;
On an idle server, the query returns no rows. That is the correct answer when no long job is running.
Watch a Backup
Run the backup in the first window, and run the monitor again and again in the second one. The backup uses small buffers on purpose. That slows it down, so there is time to watch. The STATS option prints a progress line to the first window after every 10 percent. The file lands in the default backup folder of the instance.
BACKUP DATABASE ProgressDemo TO DISK = N'ProgressDemo.bak'
WITH INIT, FORMAT, COMPRESSION, CHECKSUM, MAXTRANSFERSIZE = 65536, BUFFERCOUNT = 2, STATS = 10;
Three snapshots of one run follow. The percent climbs, the time left shrinks, and the wait type shows what the backup waits for. Your numbers will differ. The tables leave out the Statement column.
| SessionId | Operation | DatabaseName | PercentDone | ElapsedSeconds | SecondsLeft | ExpectedFinish | WaitType |
|---|---|---|---|---|---|---|---|
| 110 | BACKUP DATABASE | ProgressDemo | 6.5 | 0 | 7 | 2026-10-06 19:49:55.1228395 | ASYNC_IO_COMPLETION |
| 110 | BACKUP DATABASE | ProgressDemo | 23.9 | 1 | 5 | 2026-10-06 19:49:54.4281391 | ASYNC_IO_COMPLETION |
| 110 | BACKUP DATABASE | ProgressDemo | 40.0 | 3 | 4 | 2026-10-06 19:49:54.7383208 | ASYNC_IO_COMPLETION |
Look at the ExpectedFinish column. Each snapshot predicts a finish time, and the predictions differ by less than a second. The estimate is a projection from the work done so far. The three predictions agree within a second.
Watch a Restore and a DBCC Check
The same monitor works for the other two commands. The restore reads the backup file back over the same database, and the DBCC check reads every page. Run each one in the first window and watch the second.
USE master;
GO
RESTORE DATABASE ProgressDemo FROM DISK = N'ProgressDemo.bak' WITH REPLACE, STATS = 10;
DBCC CHECKDB (ProgressDemo) WITH NO_INFOMSGS, PHYSICAL_ONLY;
| SessionId | Operation | DatabaseName | PercentDone | ElapsedSeconds | SecondsLeft | ExpectedFinish | WaitType |
|---|---|---|---|---|---|---|---|
| 52 | RESTORE DATABASE | master | 27.0 | 0 | 1 | 2026-10-06 19:49:59.7839794 | BACKUPTHREAD |
| 110 | DBCC TABLE CHECK | ProgressDemo | 73.2 | 1 | 0 | 2026-10-06 19:50:09.9511272 | CXSYNC_PORT |
Three details need a note. The restore row shows master in DatabaseName. The session ran the restore from master, and the restored database is not the session database. The Statement column names it. The DBCC row reads DBCC TABLE CHECK, not DBCC CHECKDB, because the Operation column names the step that is running. A script that filters on the command name must know every step name. The percent filter avoids that problem, and the Statement column still shows the full CHECKDB text.
The third detail is the end of a restore. In one capture, the restore read 100.0 percent in four snapshots in a row before it finished. The data pages are copied by then, and SQL Server is still creating the log file and recovering the database. So 100 percent doesn’t mean done. Wait for the request to leave the list.
Other Ways to Watch
You could argue that the STATS option is enough. It prints progress in the window that started the job. That helps when you run the job yourself. It does nothing for a job that SQL Server Agent started, or one that a colleague started on another machine. The view works from any window and for any job.
Extended Events offer a third route. A trace of the backup and restore progress events records each step to a file. It needs a session set up before the job starts. For a job that is already running, the view is faster.
What to Remember
Filter on percent_complete > 0 and you see every long operation. Read the DatabaseName column to see which database is busy. Read the percent and the finish time to judge how long is left. Treat the estimated completion time as an estimate you can check again, not as a promise.
SQL Server doesn’t delete backup files. After the demo, run the cleanup script and remove ProgressDemo.bak from your default backup folder by hand.
USE master;
GO
IF DB_ID(N'ProgressDemo') IS NOT NULL
BEGIN
    ALTER DATABASE ProgressDemo SET SINGLE_USER WITH ROLLBACK IMMEDIATE;
    DROP DATABASE ProgressDemo;
END;
EXEC msdb.dbo.sp_delete_database_backuphistory @database_name = N'ProgressDemo';
A progress bar is not a promise, it is an estimate you can check again.
Published by Pinal Dave on SQLAuthority. More of my work at pinaldave.com.
Discover more from SQL Authority with Pinal Dave
Subscribe to get the latest posts sent to your email.

3 Comments. Leave new
You have a slight typo, Pinal. Line #13 should be Txt.Text. I have something very similar to this code that also parses out the file path of where the backup is going or where the restore is coming from and if it’s a database backup\restore or log backup\restore.
What I’ll take away from your code is the SPID. That can be handy for a lot of what we do. Thanks!
Thanks. I just fixed it.
Nice script
Since SQL server 2016 you can trace backup, restore and database recovery progress through extended events as well. This comes in handy especially with database recovery