
With DBCC CHECKDB running slow, look at the MAXDOP option first. A CHECKDB with no MAXDOP option follows the server’s max degree of parallelism. Change that server setting, or remove the option from a job, and the same check can take twice as long.

What Sets the Parallelism
DBCC CHECKDB can check objects in parallel on Enterprise class editions. Two things control how many processors it uses. The server setting max degree of parallelism applies when the statement has no option. A WITH MAXDOP = n option overrides that setting for one statement, and it can exceed the server value. Resource Governor can still cap it.
So the same command can behave differently on two servers, or on one server after someone edits a setting. A job that says DBCC CHECKDB (Sales) inherits whatever the server holds today. A job that says WITH MAXDOP = 8 keeps its own value.
Build a Database Worth Checking
A small database finishes too fast to show anything. This script builds one with about 2.1 GB of data, two tables of 540,000 rows each. It needs about 2.5 GB of free disk and runs in about 15 seconds. The timing script that follows takes about a minute. The recovery model is SIMPLE, so the log stays small.
SET NOCOUNT ON;
IF DB_ID(N'CheckDbSpeedDemo') IS NULL CREATE DATABASE CheckDbSpeedDemo;
GO
ALTER DATABASE CheckDbSpeedDemo SET RECOVERY SIMPLE;
GO
USE CheckDbSpeedDemo;
GO
DROP TABLE IF EXISTS dbo.Parts, dbo.Bins;
CREATE TABLE dbo.Parts (PartID int NOT NULL PRIMARY KEY, Maker int NOT NULL, Note char(2000) NOT NULL);
CREATE TABLE dbo.Bins (BinID int NOT NULL PRIMARY KEY, Qty int NOT NULL, Note char(2000) NOT NULL);
CREATE INDEX IX_Parts_Maker ON dbo.Parts (Maker);
GO
DECLARE @i int = 0;
WHILE @i < 9
BEGIN
    INSERT INTO dbo.Parts (PartID, Maker, Note)
    SELECT TOP (60000) @i * 60000 + ROW_NUMBER() OVER (ORDER BY (SELECT NULL)), ABS(CHECKSUM(NEWID())) % 100, 'x'
    FROM sys.all_objects AS a CROSS JOIN sys.all_objects AS b;
    INSERT INTO dbo.Bins (BinID, Qty, Note)
    SELECT TOP (60000) @i * 60000 + ROW_NUMBER() OVER (ORDER BY (SELECT NULL)), 1, 'x'
    FROM sys.all_objects AS a CROSS JOIN sys.all_objects AS b;
    CHECKPOINT;
    SET @i += 1;
END;
First, read the server setting that applies when there is no option.
SELECT name, value_in_use
FROM sys.configurations
WHERE name = N'max degree of parallelism';
| name | value_in_use |
|---|---|
| max degree of parallelism | 2 |
This server is set to 2. The test machine has 16 logical processors, so a CHECKDB that follows the server setting leaves most of them idle.
Time Four Settings
The next script runs CHECKDB once to warm the cache. Then it times four variants and one more with PHYSICAL_ONLY. It builds each statement as text, because MAXDOP can’t take a variable. NO_INFOMSGS keeps the output short.
SET NOCOUNT ON;
DECLARE @options TABLE (Label varchar(40), Opt nvarchar(80));
INSERT @options (Label, Opt) VALUES
    ('MAXDOP 1', N', MAXDOP = 1'),
    ('No MAXDOP option', N''),
    ('MAXDOP 0', N', MAXDOP = 0'),
    ('MAXDOP 8', N', MAXDOP = 8'),
    ('PHYSICAL_ONLY, MAXDOP 0', N', PHYSICAL_ONLY, MAXDOP = 0');
DECLARE @results TABLE (Label varchar(40), ElapsedMs int);
DECLARE @label varchar(40), @opt nvarchar(80), @sql nvarchar(max), @t datetime2;
DBCC CHECKDB (CheckDbSpeedDemo) WITH NO_INFOMSGS;
DECLARE c CURSOR LOCAL FAST_FORWARD FOR SELECT Label, Opt FROM @options;
OPEN c;
FETCH NEXT FROM c INTO @label, @opt;
WHILE @@FETCH_STATUS = 0
BEGIN
    SET @sql = N'DBCC CHECKDB (CheckDbSpeedDemo) WITH NO_INFOMSGS' + @opt + N';';
    SET @t = SYSDATETIME();
    EXEC (@sql);
    INSERT @results (Label, ElapsedMs) VALUES (@label, DATEDIFF(MILLISECOND, @t, SYSDATETIME()));
    FETCH NEXT FROM c INTO @label, @opt;
END;
CLOSE c;
DEALLOCATE c;
SELECT Label, ElapsedMs FROM @results;| Label | ElapsedMs |
|---|---|
| MAXDOP 1 | 6904 |
| No MAXDOP option | 5047 |
| MAXDOP 0 | 2691 |
| MAXDOP 8 | 2304 |
| PHYSICAL_ONLY, MAXDOP 0 | 2504 |
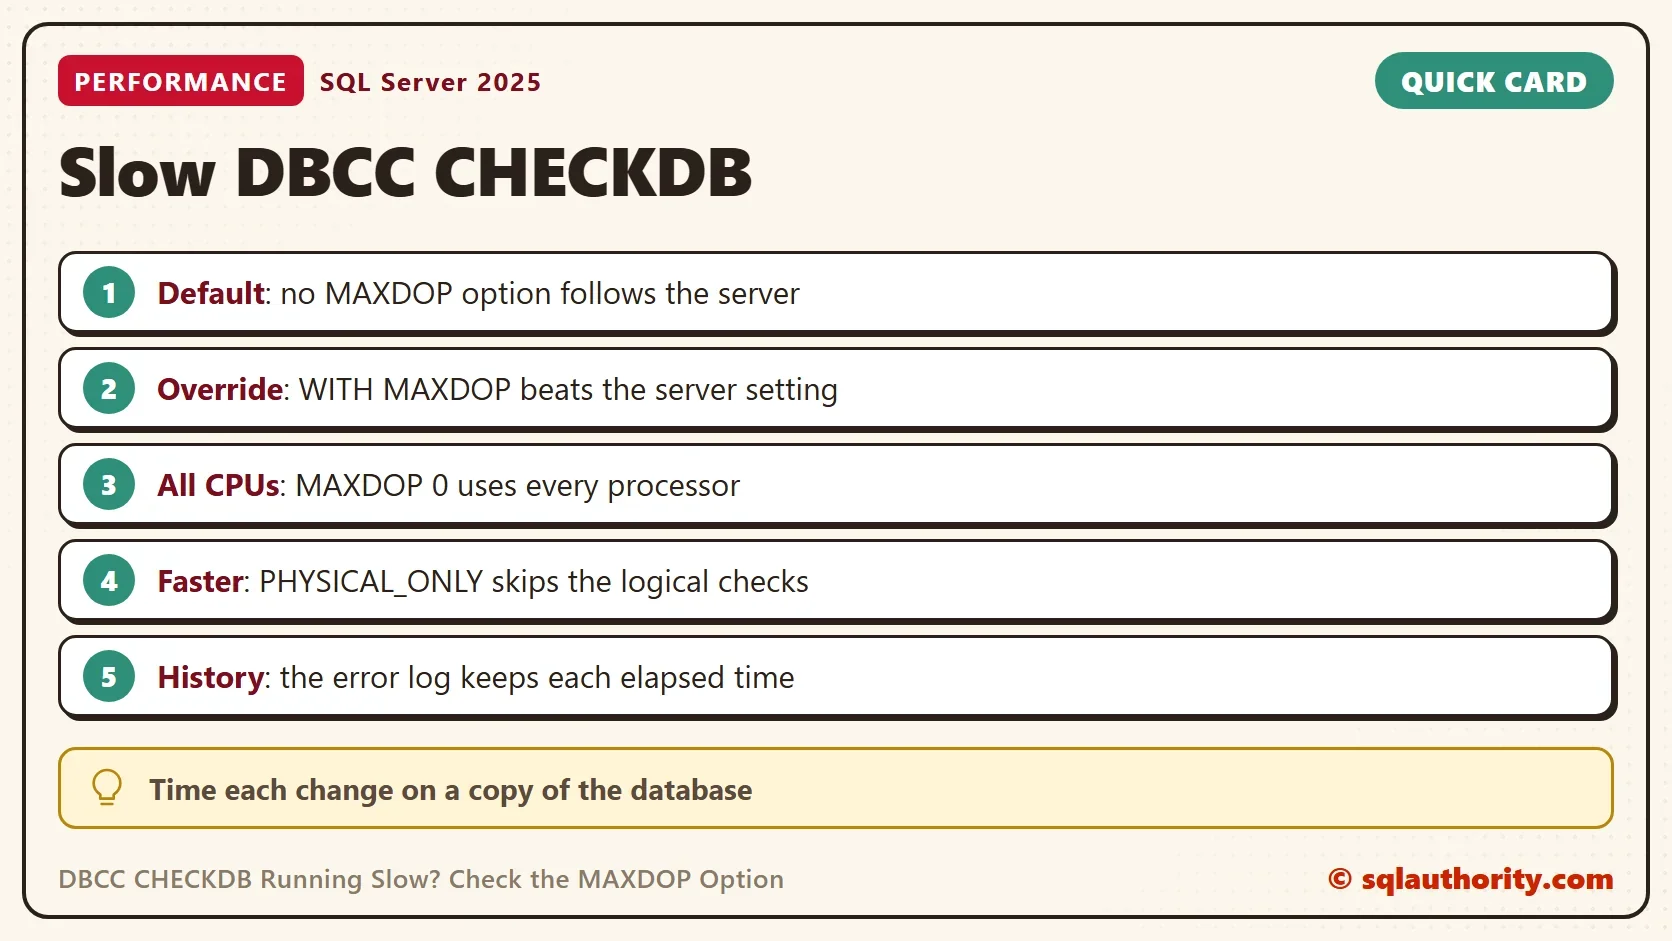
On this server the check with no option ran at the speed of the server setting, which is 2. Setting MAXDOP = 1 was slower. MAXDOP = 0 lets the check use every processor. That and MAXDOP = 8 were both about twice as fast as no option. Going from 8 to all 16 processors added nothing. The timings move from run to run.
In every clean run, MAXDOP = 1 was the slowest and no option came second. One run on a busy server broke that order. Treat the numbers as an example, not a promise.
PHYSICAL_ONLY is a different trade. It skips the logical checks, and it still validates page checksums and catches torn pages and common I/O errors. Here it finished in 2,504 ms against 2,691 ms for the full check, a gain of about 0.2 seconds. The tables in this demo are plain, so there is little logical work to skip. Test it on your own data before you count on it. One plan is PHYSICAL_ONLY on weekdays and the full check on weekends.
Compare With the Past
A DBCC CHECKDB running slow is only slow compared with an earlier run. SQL Server writes a line to the error log for each CHECKDB, and the line includes the elapsed time. Read your history with the search text DBCC CHECKDB and your database name. The shorter text CHECKDB also matches a database whose name contains it, and returns startup lines too.
EXEC sp_readerrorlog 0, 1, N'DBCC CHECKDB', N'CheckDbSpeedDemo';
The query returns one line for every run of the demo database, with the time it took. A jump in that list tells you when the change happened. Then look at what changed around that date. Check the server MAXDOP, the job text, the data size and other work at night. The percent complete of a running check helps with progress. It can’t tell you whether the run is slower than last week’s.
Other Causes to Rule Out
When you see DBCC CHECKDB running slow, rule out the simple causes too. Data growth makes every check longer, so compare the database size too. Other work on the same disks competes with the check. So does a backup that starts in the same window. When the cause isn’t the settings, the error log history and the database size tell you where to look.
You could argue that MAXDOP = 0 is the right choice everywhere. It makes the check fastest, and it also takes every processor from the users. A good setting depends on the maintenance window. Choose a number and time it on a restored copy. Write it in the job, so a server change can’t alter it.
What to Remember
Put the MAXDOP option in the job, and leave a comment with the reason. Keep the error log history. Run the cleanup script when you finish.
USE master;
GO
IF DB_ID(N'CheckDbSpeedDemo') IS NOT NULL
BEGIN
    ALTER DATABASE CheckDbSpeedDemo SET SINGLE_USER WITH ROLLBACK IMMEDIATE;
    DROP DATABASE CheckDbSpeedDemo;
END;
A slow check is not a bad database, it is a setting nobody wrote down.
Published by Pinal Dave on SQLAuthority. More of my work at pinaldave.com.
Discover more from SQL Authority with Pinal Dave
Subscribe to get the latest posts sent to your email.




2 Comments. Leave new
Hi Pinal
How can one determine if checkdb is running faster or slower, does percent_complete give that indication
In this case it was a comparison between past and now.