
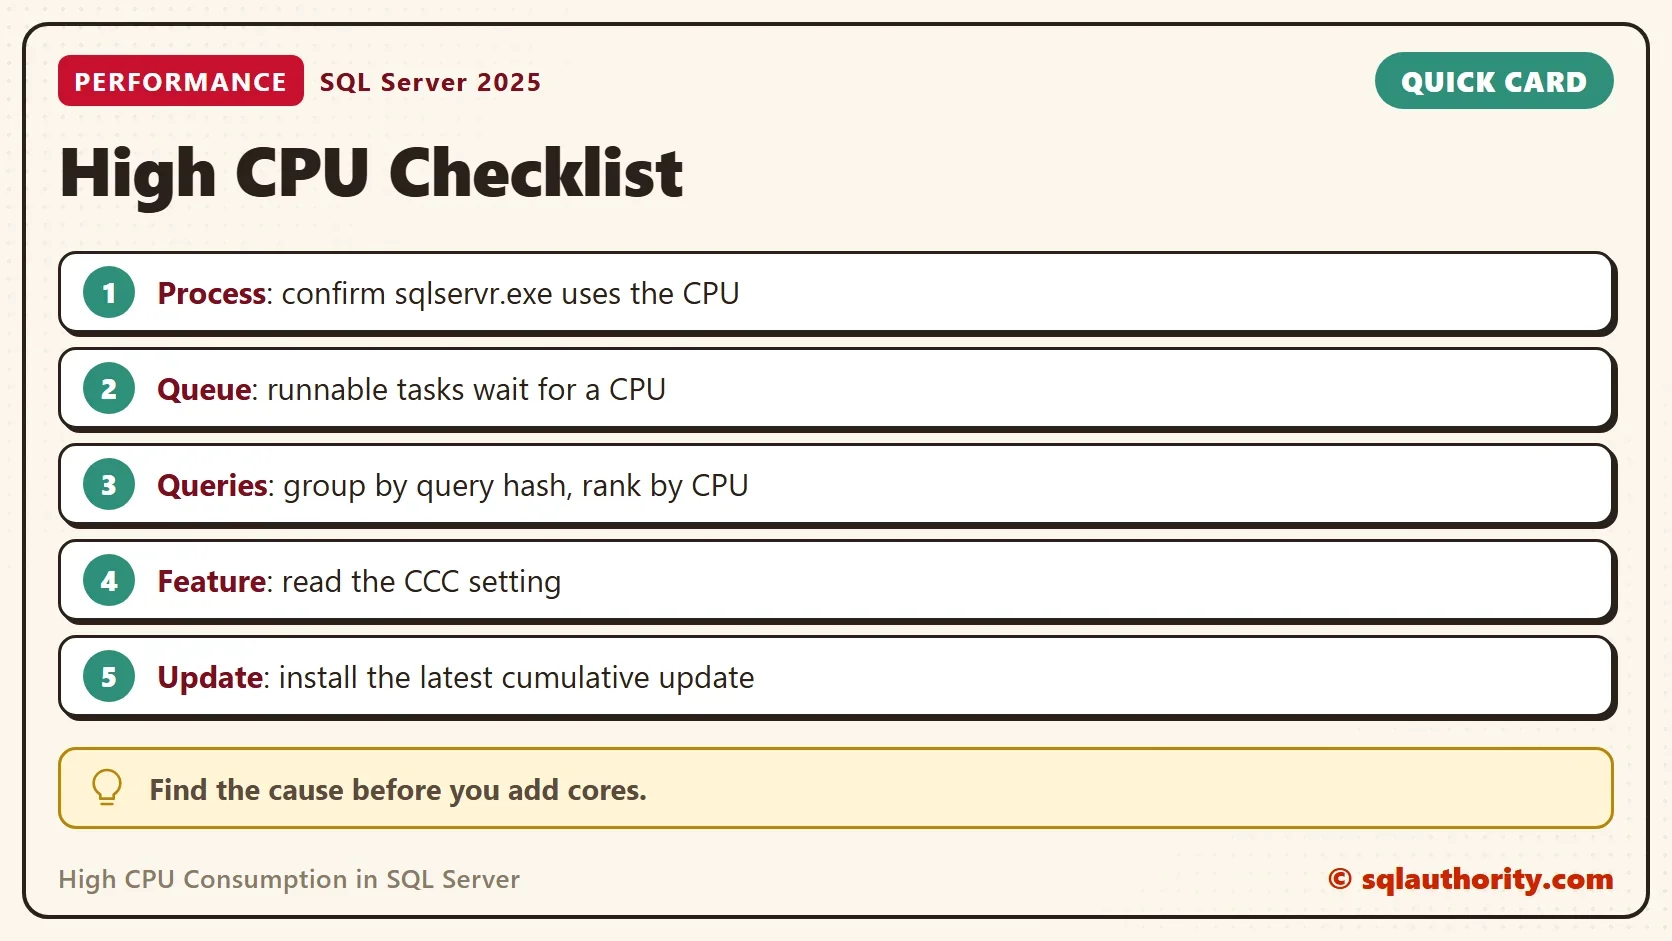
High CPU consumption in SQL Server has a short list of causes, and a checklist finds them in order. First confirm that SQL Server is the process using the CPU. Then read the queue of waiting tasks and rank the queries by CPU. Last, check the features that add overhead.

Step One: Is It SQL Server?
Open Task Manager or Performance Monitor on the server, and look at the process list. If sqlservr.exe isn’t the top CPU user, SQL Server isn’t the problem. An antivirus scan, a backup agent or a monitoring tool can use more CPU than the database. Rule that out first, because nothing in SQL Server will fix it.
Step Two: Do Tasks Wait for a CPU?
High CPU usage matters when work waits for it. Each scheduler keeps a queue of tasks that are ready to run and wait for their turn. The count of those tasks is the signal.
SELECT COUNT(*) AS Schedulers, SUM(runnable_tasks_count) AS RunnableTasks
FROM sys.dm_os_schedulers
WHERE status = N'VISIBLE ONLINE';
The test server has 16 schedulers, and it showed 0 runnable tasks while idle. A few runnable tasks are normal under load. A count that stays high across repeated runs, every few seconds, means queries wait for CPU. Run the query several times before you decide.
Step Three: Rank the Queries by CPU
SQL Server keeps CPU statistics for every cached query in sys.dm_exec_query_stats. The next query adds them up by query hash, which merges statements that differ only in their literal values. That gives one line for each query shape. It also shows each shape’s share of the CPU recorded in the cache.
SELECT TOP (5) c.Runs, c.TotalCpuMs,
       CAST(100.0 * c.TotalCpu / SUM(c.TotalCpu) OVER () AS decimal(5,1)) AS PercentOfCachedCpu,
       LEFT(REPLACE(REPLACE(st.text, CHAR(13), N' '), CHAR(10), N' '), 80) AS StatementStart
FROM (SELECT query_hash, SUM(total_worker_time) AS TotalCpu, SUM(total_worker_time) / 1000 AS TotalCpuMs, SUM(execution_count) AS Runs, MIN(sql_handle) AS SqlHandle
      FROM sys.dm_exec_query_stats
      GROUP BY query_hash) AS c
CROSS APPLY sys.dm_exec_sql_text(c.SqlHandle) AS st
ORDER BY c.TotalCpu DESC;
The numbers depend on your server, so there is no sample result here. Read the top line first. A single shape that holds most of the CPU is a tuning target. A flat list with no leader points away from queries and toward a feature or a setting.
The view covers only plans that are still in the cache. A restart, a cache clear or memory pressure erases the history. Read it after the server has run for a day or more.
Step Four: Check Common Criteria Compliance
High CPU consumption after an upgrade can come from a setting, not from a query. Common Criteria Compliance is a security setting that adds work such as residual information protection and login statistics. On SQL Server 2016 and 2017, that overhead showed up as high CPU after upgrades. In one customer case, the queries ran faster after tuning, and the CPU stayed high.
The setting is easy to read.
SELECT name, value, value_in_use FROM sys.configurations WHERE name = N'common criteria compliance enabled';
| name | value | value_in_use |
|---|---|---|
| common criteria compliance enabled | 0 | 0 |
The test server shows 0, so the feature is off. If your server shows 1, the setting is a suspect. The fix in that case was the latest cumulative update. SQL Server 2016 needed trace flag 3427 as well. Check the version and update level first, and list the global trace flags that are on.
SELECT SERVERPROPERTY('ProductVersion') AS ProductVersion, SERVERPROPERTY('ProductUpdateLevel') AS UpdateLevel;
DBCC TRACESTATUS(-1);
Install the latest cumulative update before you add the trace flag. Add the flag only if the update notes ask for it on your build. If the setting shows 0, as it does on the test server, stop here.
Step Five: What Changed?
CPU rises for a reason. Ask what changed: an upgrade, a new compatibility level, an application release or a new report. Line the date of the change up with the date the CPU rose. Query Store, when it’s on, keeps runtime history inside the database. It shows which queries got slower or more expensive after the change, and it keeps the earlier plans for comparison.
Should You Turn the Setting Off?
You could argue that the quick fix is to switch the feature off. That can lower the CPU at once. Common Criteria Compliance exists for compliance reasons, though, and the security team owns that decision. Ask them before you change it, and take the update path first.
Is It Time to Add Cores?
More cores seem like an easy answer. Core licensing means every added core adds cost. A tuned query or an update costs less. Add hardware after the checklist leaves no other cause.
What to Remember
Check the process, the runnable tasks, the top queries and the compliance setting when you see high CPU consumption. Read the numbers over time, not once. Keep notes on each answer, so the next check starts where this one ended. Install the latest cumulative update, and keep a record of the build before and after. Every query here only reads, so there is nothing to clean up.
High CPU is not a verdict, it is a question, and the checklist asks it in order.
Published by Pinal Dave on SQLAuthority. More of my work at pinaldave.com.
Discover more from SQL Authority with Pinal Dave
Subscribe to get the latest posts sent to your email.



11 Comments. Leave new
I’m glad I read your daily blogs Pinal. I never knew about Common Criteria in SQL Server.
Yeah. I learned it hard way.
Hi Pinal
Thank you very much for letting us know about this problem and solution …much appreciated
Is it safe to just disable the CCC option in the server configuration until the CU can be installed preferably outside business hours.
CCC is more for compliance purpose. So, you really need to check with your security team if they are OK to disable that.
Hi , So its good to have disable this trace -CCC ,isnt
hi
quick question
We have sql server 2016 sp2 cu3 applied do you think by enabling traceflag 3427 will help to control the high cpu issue any suggestions will help
Hi Pinal,
If CCC is disabled, Will it still contribute for CPU high intensiveness?
Regards,
Chella
Do you have to enable trace flag 3427 on the 2016 SP2 CU8? as this seems not applicable on the latest CUs
Hi Pinal,
I have same issue while upgrade from sql server 2016 to sql server 2019 on azure vm previously i was using the rackspace server with sql 2016 it’s working fine please help
Hi Dinesh
Did you find a solution?
Hi we are using sql server 2017 and it takes around 100 gb usage of my server ? what should i do ?