
Optimize for Ad Hoc Workloads is a server setting that shrinks the plan cache memory taken by one-time queries. It helps a lot on some servers and not at all on others. The difference is easy to measure before you change anything.

What the Setting Does
Every query that SQL Server runs needs a plan. SQL Server keeps the plan in the plan cache, so the next run of the same text can reuse it. An ad hoc query has its values written into the text, such as a TOP (5) or a quoted name. Change one value and the text changes, so SQL Server compiles and stores a new plan.
A server that receives thousands of such queries fills its cache with plans that nobody runs twice. The setting changes what gets stored. With it on, the first run of a batch stores a small stub instead of the full plan. The full plan is stored only when the same batch runs a second time.
The price is one extra compile. A batch that runs again compiles once for the stub and once more for the full plan. The setting takes effect without a restart.
See Single-Use Plans in Action
The demo creates a database named AdHocPlanDemo with a five-row table. A loop then runs 20 batches. Each one differs only in the number inside TOP, so each gets its own plan. A comment tag marks them, which makes them easy to find. After the loop, the first batch runs two more times.
IF DB_ID(N'AdHocPlanDemo') IS NULL CREATE DATABASE AdHocPlanDemo;
GO
USE AdHocPlanDemo;
GO
DROP TABLE IF EXISTS dbo.Products;
CREATE TABLE dbo.Products (ProductID int IDENTITY(1,1) PRIMARY KEY, ProductName nvarchar(40) NOT NULL);
INSERT INTO dbo.Products (ProductName) VALUES (N'Notebook'), (N'Pencil'), (N'Stapler'), (N'Ruler'), (N'Marker');
GO
DECLARE @i int = 1, @sql nvarchar(400);
WHILE @i <= 20
BEGIN
    SET @sql = N'DECLARE @c int; SELECT @c = COUNT(*) FROM (SELECT TOP (' + CAST(@i AS nvarchar(3)) + N') ProductName FROM dbo.Products ORDER BY ProductName) AS x; /* AdHocDemoMarker */';
    EXEC (@sql);
    SET @i += 1;
END;
SET @sql = N'DECLARE @c int; SELECT @c = COUNT(*) FROM (SELECT TOP (1) ProductName FROM dbo.Products ORDER BY ProductName) AS x; /* AdHocDemoMarker */';
EXEC (@sql);
EXEC (@sql);
Now look in the plan cache. The query counts the plans that carry the tag, and how many were used only once.
SELECT cp.objtype AS PlanType,
       COUNT(*) AS Plans,
       SUM(CASE WHEN cp.usecounts = 1 THEN 1 ELSE 0 END) AS SingleUsePlans,
       MAX(cp.usecounts) AS MostReused,
       SUM(CAST(cp.size_in_bytes AS bigint)) / 1024 AS SizeKB
FROM sys.dm_exec_cached_plans AS cp
CROSS APPLY sys.dm_exec_sql_text(cp.plan_handle) AS st
WHERE st.text LIKE N'%AdHocDemoMarker%'
  AND st.text NOT LIKE N'%dm_exec_cached_plans%'
GROUP BY cp.objtype;| PlanType | Plans | SingleUsePlans | MostReused | SizeKB |
|---|---|---|---|---|
| Adhoc | 20 | 19 | 3 | 1120 |
Twenty plans sit in the cache, and 19 of them were used once. Only the repeated batch earned its place, with three uses. Each plan takes 56 KB, which is 1.1 MB for a demo with five rows. A busy server with a million distinct texts has a real problem.
Measure the Whole Cache
The next query measures the plan cache of the whole instance. It adds up the size of single-use ad hoc plans, adds up the size of everything, and shows the share. Dividing by 1048576 turns bytes into megabytes.
WITH CacheSizes AS (
    SELECT SUM(CASE WHEN objtype = N'Adhoc' AND usecounts = 1 THEN CAST(size_in_bytes AS bigint) ELSE 0 END) / 1048576.0 AS SingleUseMB,
           SUM(CAST(size_in_bytes AS bigint)) / 1048576.0 AS TotalMB
    FROM sys.dm_exec_cached_plans
)
SELECT CAST(SingleUseMB AS decimal(12,2)) AS SingleUseAdHocMB,
       CAST(TotalMB AS decimal(12,2)) AS TotalPlanCacheMB,
       CAST(100.0 * SingleUseMB / NULLIF(TotalMB, 0) AS decimal(5,1)) AS SingleUsePercent
FROM CacheSizes;
The query counts only plans with a use count of 1. An ad hoc plan that gets reused isn’t waste, so it stays out of the number.
The CAST to bigint matters. The size column is an int, and on a large cache its sum overflows with error 8115. The numbers change on every run, so read them on your own server.
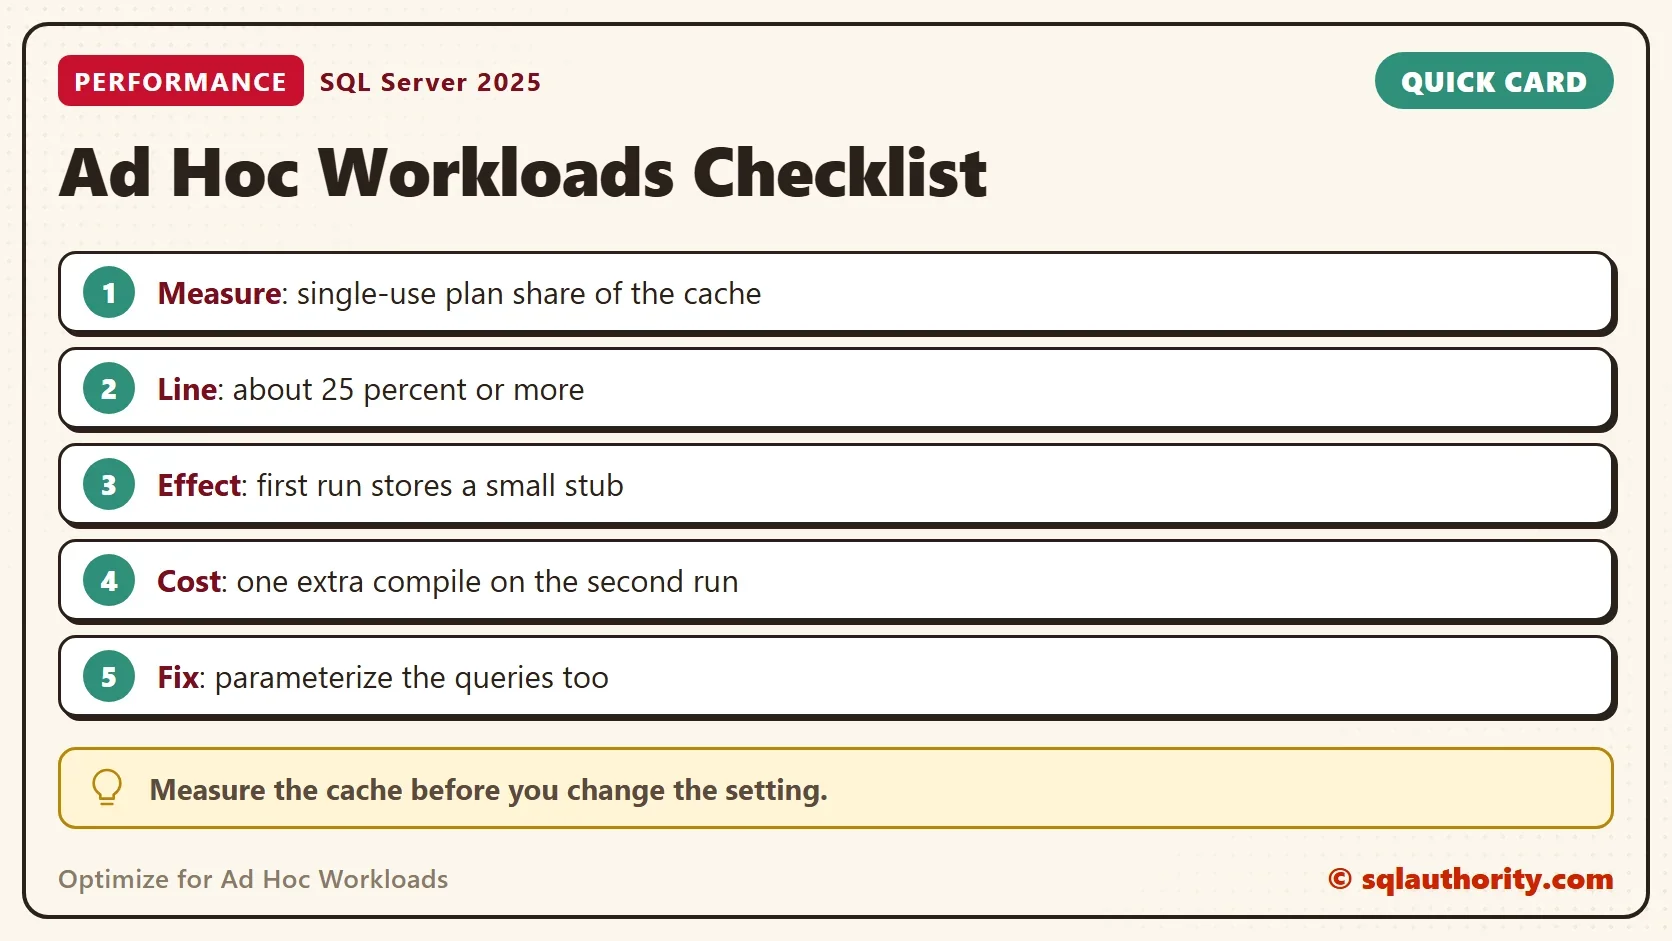
In my health checks, I turn it on when single-use plans fill a quarter of the cache. That’s a habit, not a documented limit. A share of 52, 60 or 90 percent is a clear yes. Turn it on, and parameterize the worst queries too. A share of 5 percent isn’t worth a change. Read the number after the server has run for a few days. A restart empties the cache, and a young cache says little.
Check the Current Setting
The setting is off by default. This query shows whether it’s on for your instance.
SELECT name, value_in_use FROM sys.configurations WHERE name = N'optimize for ad hoc workloads';
| name | value_in_use |
|---|---|
| optimize for ad hoc workloads | 0 |
After you turn it on, the cache lists the small plans under the cache object type Compiled Plan Stub. They’re much smaller than full plans, which is where the memory comes back. Compare the SQL Compilations/sec counter with Batch Requests/sec as well. When the two are close, almost every batch compiles.
To change it, open Server Properties in SSMS and go to Advanced. Or run the statements below. Test the change on a copy of the workload first.
The next block changes a server-wide option, and it enables show advanced options first. It isn’t part of the demo, so run it only on a server where you mean to change the setting.
EXEC sys.sp_configure N'show advanced options', 1;
RECONFIGURE;
EXEC sys.sp_configure N'optimize for ad hoc workloads', 1;
RECONFIGURE;
The undo is the same statement with 0 as the last value.
EXEC sys.sp_configure N'optimize for ad hoc workloads', 0;
RECONFIGURE;
Fix the Cause, Not Only the Cost
The setting reduces what single-use plans cost. It doesn’t stop the queries from compiling. The better fix is to send values as parameters. Use sp_executesql, a stored procedure or an ORM that parameterizes. One plan then serves every value.
You could argue that the setting hides the problem, and that’s true. It also adds a compile for batches that repeat. On a server where plans are reused, the single-use share is small and the setting does nothing useful. That’s why the measurement comes first.
What to Remember
Count the single-use ad hoc plans and compare them with the whole cache. If the share is high, turn Optimize for Ad Hoc Workloads on and parameterize the worst queries. If it’s low, leave the setting alone. Clean up the demo when you finish.
USE master;
GO
ALTER DATABASE AdHocPlanDemo SET SINGLE_USER WITH ROLLBACK IMMEDIATE;
DROP DATABASE AdHocPlanDemo;
A plan cache is not a warehouse, it is a desk, and one-time papers shouldn’t pile up on it.
Published by Pinal Dave on SQLAuthority. More of my work at pinaldave.com.
Discover more from SQL Authority with Pinal Dave
Subscribe to get the latest posts sent to your email.




12 Comments. Leave new
Great Tip!
In my case, I was getting an “Arithmetic overflow error converting expression to data type int.” error. I had to use sum(cast(size_in_bytes as bigint)) to fix it.
Same as Eric, except I just multiplied the summed values * 1.0.
SELECT [AdHoc_Plan_MB],
[Total_Cache_MB],
[AdHoc %] = [AdHoc_Plan_MB] * 100.0 / [Total_Cache_MB]
FROM (
SELECT
[AdHoc_Plan_MB] = SUM(CASE
WHEN [objtype] = ‘adhoc’ THEN [size_in_bytes]
ELSE 0
END * 1.0) / 1048576.0,
[Total_Cache_MB] = SUM([size_in_bytes] * 1.0) / 1048576.0
FROM [sys].[dm_exec_cached_plans]
) [T];
I have ad-hoc plan cache is about 90% on my productions servers. So, I should turn on this option, right?
Why do you divide by 1048576?
I found that if I convert the values to floats before summing, it fixes the overflow issue..
SELECT AdHoc_Plan_MB, Total_Cache_MB,
AdHoc_Plan_MB*100.0 / Total_Cache_MB AS ‘AdHoc %’
FROM (
SELECT SUM(CASE
WHEN objtype = ‘adhoc’
THEN convert(float,size_in_bytes)
ELSE 0 END) / 1048576.0 AdHoc_Plan_MB,
SUM(convert(float,size_in_bytes)) / 1048576.0 Total_Cache_MB
FROM sys.dm_exec_cached_plans) T
Should you need to filter out by cached plans only used once “objtype = ‘Adhoc’ AND usecounts = 1”
I believe this is the right way… if a cached plan has been used thousands of times, then it’s not a waste of RAM. It might also be good to “tune” this threshold – something like “… and useCounts < @threshold …"
My Adhoc% is 52, which is not between 20-30%. Currently it is set to false. Should I change it to True?
I am planning to enable this on our PROD servers since adhoc cache is very huge. Aside from the adhoc cache percentage, are there other measures in SQL that we can check to verify that enabling this parameter is really helpful?
Our AdHoc % is about 60%, should I turn it ON or OFF?
I believe Dave wanted to say if it is > 20 – 30 %, not between. I have adhoc 77% on server. I am parameterizing SPs to lower this but also I have switched the option ON.
I personally turn it on when I see over 25 % of ad-hoc queries.