
SQL Server performance mistakes hide in three places: the server settings, the files and the code. On January 20, 2017, I presented 3 Common Mistakes to Kill SQL Server Performance at the first GroupBy Conference. The conference was free, and the community chose the sessions by voting on the speakers' proposals.

Check 1: Settings Nobody Remembers Choosing
The first of the SQL Server performance mistakes is a setting that someone changed years ago, or never changed. Start with four settings. This query reads their configured value and the value in use. It changes nothing.
SELECT name AS Setting, value AS Configured, value_in_use AS InUse
FROM sys.configurations
WHERE name IN (N'max server memory (MB)', N'cost threshold for parallelism', N'max degree of parallelism', N'optimize for ad hoc workloads')
ORDER BY name;
| Setting | Configured | InUse |
|---|---|---|
| cost threshold for parallelism | 50 | 50 |
| max degree of parallelism | 2 | 2 |
| max server memory (MB) | 2147483647 | 2147483647 |
| optimize for ad hoc workloads | 0 | 0 |
On the test instance, max server memory still shows 2147483647. That is the default, and it lets SQL Server keep growing until the operating system and other programs run short. Set it to a figure that leaves them room.
The cost threshold for parallelism has a default of 5, so tiny queries can go parallel for no gain. Here it is 50. The max degree of parallelism default is 0, which allows every processor. Here it is 2. Both differ from the defaults. Change one setting at a time, test it on your workload, and write down why.
Check 2: Files in Tiny Growth Steps
A database file that grows by 1 MB, or by a percentage, pauses the session that triggers the growth. Instant file initialization shortens the pause for data files, never for the log. A tiny step means many pauses. A percentage on a large file means one huge pause at the worst moment. The demo database is named ThreeMistakesDemo and exists for this post only, so run it on a test server. The script creates it, then sets the poor growth settings on purpose.
IF DB_ID(N'ThreeMistakesDemo') IS NULL CREATE DATABASE ThreeMistakesDemo;
GO
ALTER DATABASE ThreeMistakesDemo MODIFY FILE (NAME = ThreeMistakesDemo, FILEGROWTH = 1MB);
ALTER DATABASE ThreeMistakesDemo MODIFY FILE (NAME = ThreeMistakesDemo_log, FILEGROWTH = 10%);
Now ask where the files live and how they grow. The query also names the volume, so you can see whether data and log share one drive.
SELECT mf.name AS FileName, mf.type_desc AS FileType, CAST(mf.size * 8 / 1024.0 AS decimal(10,1)) AS SizeMB,
       CASE WHEN mf.is_percent_growth = 1 THEN CAST(mf.growth AS varchar(10)) + ' percent'
            ELSE CAST(mf.growth * 8 / 1024 AS varchar(10)) + ' MB' END AS GrowthSetting,
       vs.volume_mount_point AS Volume
FROM sys.master_files AS mf
CROSS APPLY sys.dm_os_volume_stats(mf.database_id, mf.file_id) AS vs
WHERE mf.database_id = DB_ID(N'ThreeMistakesDemo')
ORDER BY mf.type, mf.name;| FileName | FileType | SizeMB | GrowthSetting | Volume |
|---|---|---|---|---|
| ThreeMistakesDemo | ROWS | 8.0 | 1 MB | C:\ |
| ThreeMistakesDemo_log | LOG | 8.0 | 10 percent | C:\ |
Both files start at 8 MB and grow in steps that are too small or too variable. Both also sit on one volume here, which is fine for a test box and a risk for production. Where possible, keep data, log and tempdb on separate volumes, for recovery safety and, on separate disks, for speed.
The fix is a fixed growth size, in megabytes, sized to the workload. Pre-size the files so growth stays rare. The next script sets the growth step to 256 MB for the data file and 128 MB for the log. It then reads the settings back.
ALTER DATABASE ThreeMistakesDemo MODIFY FILE (NAME = ThreeMistakesDemo, FILEGROWTH = 256MB);
ALTER DATABASE ThreeMistakesDemo MODIFY FILE (NAME = ThreeMistakesDemo_log, FILEGROWTH = 128MB);
GO
SELECT mf.name AS FileName, mf.type_desc AS FileType,
       CASE WHEN mf.is_percent_growth = 1 THEN CAST(mf.growth AS varchar(10)) + ' percent'
            ELSE CAST(mf.growth * 8 / 1024 AS varchar(10)) + ' MB' END AS GrowthSetting
FROM sys.master_files AS mf
WHERE mf.database_id = DB_ID(N'ThreeMistakesDemo')
ORDER BY mf.type, mf.name;| FileName | FileType | GrowthSetting |
|---|---|---|
| ThreeMistakesDemo | ROWS | 256 MB |
| ThreeMistakesDemo_log | LOG | 128 MB |
Check 3: Code That Reads Too Much
A query can return one row and still read thousands of pages. Two causes show up most. The first is a function wrapped around an indexed column. The second is a parameter whose data type differs from the column. The next script builds 100,000 orders with two indexes.
USE ThreeMistakesDemo;
GO
DROP TABLE IF EXISTS dbo.Orders;
CREATE TABLE dbo.Orders (
    OrderID       int IDENTITY(1,1) NOT NULL PRIMARY KEY,
    OrderDate     date          NOT NULL,
    AccountNumber varchar(20)   NOT NULL,
    Total         decimal(10,2) NOT NULL,
    Note          char(200)     NOT NULL DEFAULT ''
);
WITH n AS (
    SELECT TOP (100000) ROW_NUMBER() OVER (ORDER BY (SELECT NULL)) AS n
    FROM sys.all_objects AS a CROSS JOIN sys.all_objects AS b
)
INSERT INTO dbo.Orders (OrderDate, AccountNumber, Total)
SELECT DATEADD(DAY, n % 1000, '2024-01-01'), 'AC-' + RIGHT('000000' + CAST(n % 20000 AS varchar(6)), 6), n % 500 + 0.99
FROM n;
CREATE INDEX IX_Orders_OrderDate ON dbo.Orders (OrderDate) INCLUDE (Total);
CREATE INDEX IX_Orders_AccountNumber ON dbo.Orders (AccountNumber);
The first test asks for the revenue of March 2026. The first query wraps OrderDate in YEAR and MONTH, so SQL Server must compute them for every row. The second asks for the same dates as a range, which the index can seek. SET STATISTICS IO ON prints the pages read to the Messages tab.
SET STATISTICS IO ON;
SELECT SUM(Total) AS Revenue FROM dbo.Orders WHERE YEAR(OrderDate) = 2026 AND MONTH(OrderDate) = 3;
SELECT SUM(Total) AS Revenue FROM dbo.Orders WHERE OrderDate >= '2026-03-01' AND OrderDate < '2026-04-01';
SET STATISTICS IO OFF;
| Version | Revenue | Logical reads |
|---|---|---|
| YEAR and MONTH on the column | 948569.00 | 274 |
| Date range | 948569.00 | 12 |
Both return the same revenue. The function version reads 274 pages and the range reads 12. The function hides the column from the index, so every row in the index gets checked.
The second test compares a varchar column with an nvarchar parameter. The column is varchar(20), and the first parameter is nvarchar(20). Data type precedence converts the column to nvarchar for every row, so the index can't be sought. This holds for a database with a SQL collation, such as this one.
SET STATISTICS IO ON;
DECLARE @Wide nvarchar(20) = N'AC-000500';
SELECT SUM(Total) AS Revenue FROM dbo.Orders WHERE AccountNumber = @Wide;
DECLARE @Narrow varchar(20) = 'AC-000500';
SELECT SUM(Total) AS Revenue FROM dbo.Orders WHERE AccountNumber = @Narrow;
SET STATISTICS IO OFF;
| Parameter type | Revenue | Logical reads |
|---|---|---|
| nvarchar | 4.95 | 302 |
| varchar | 4.95 | 17 |
The mismatch costs 302 reads against 17. Match the parameter to the column type. In application code, set the type on the parameter in place of relying on the default.
You don't find these SQL Server performance mistakes by reading code. Ask the server which statements read the most. The query below lists the heaviest statements in this database from the plan cache. The numbers reset when a plan leaves the cache or the server restarts, so treat them as a starting list.
SELECT TOP (3) qs.total_logical_reads / qs.execution_count AS AvgReads, qs.execution_count AS Runs,
       LEFT(SUBSTRING(st.text, qs.statement_start_offset / 2 + 1,
            (CASE qs.statement_end_offset WHEN -1 THEN DATALENGTH(st.text) ELSE qs.statement_end_offset END - qs.statement_start_offset) / 2 + 1), 90) AS StatementStart
FROM sys.dm_exec_query_stats AS qs
CROSS APPLY sys.dm_exec_sql_text(qs.sql_handle) AS st
CROSS APPLY sys.dm_exec_plan_attributes(qs.plan_handle) AS pa
WHERE pa.attribute = N'dbid' AND pa.value = DB_ID()
ORDER BY AvgReads DESC;| AvgReads | Runs | StatementStart |
|---|---|---|
| 161042 | 1 | WITH n AS ( SELECT TOP (100000) ROW_NUMBER() OVER (ORDER BY (SELECT NULL)) AS n FR |
| 302 | 1 | SELECT SUM(Total) AS Revenue FROM dbo.Orders WHERE AccountNumber = @Wide |
| 274 | 1 | SELECT SUM(Total) AS Revenue FROM dbo.Orders WHERE YEAR(OrderDate) = 2026 AND MONTH(OrderD |
The load script tops the list, because it wrote 100,000 rows, and its count differs from run to run. Right under it are the two mistakes. Fix the one that reads the most, and measure again.
Is Faster Hardware Cheaper Than Tuning?
You could argue that faster hardware is cheaper than tuning. For a while it is. The SQL Server performance mistakes above scale with the data, though. A function on an indexed column reads every row, so a table ten times larger costs ten times more. Hardware hides the problem and the bill keeps growing.
What to Remember
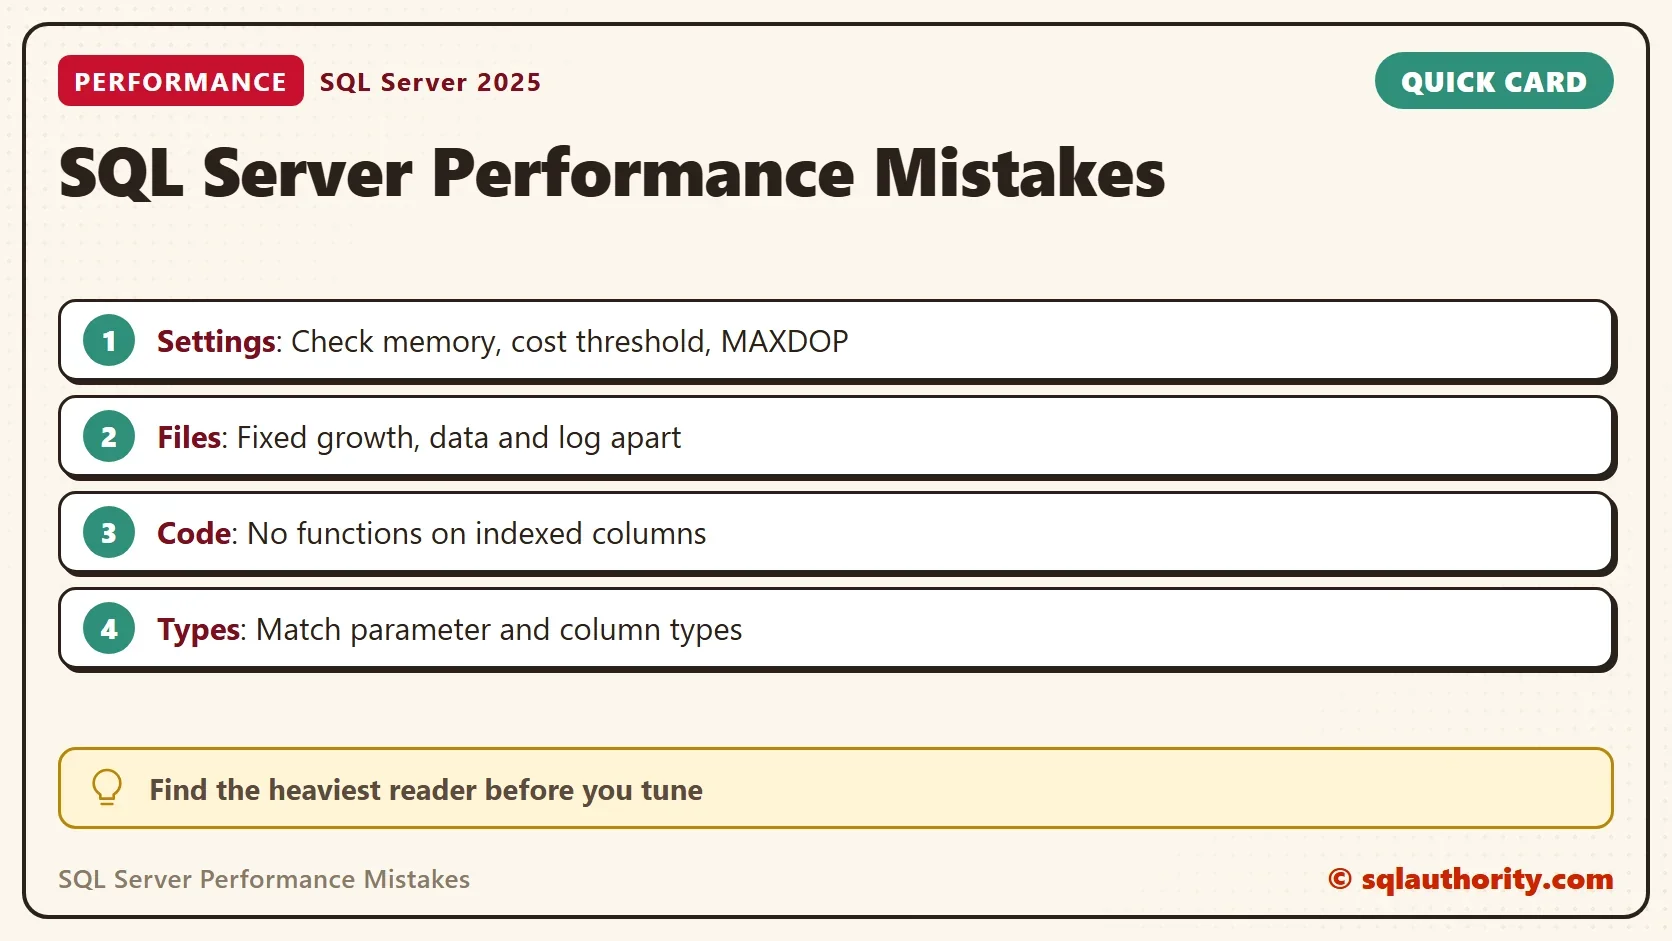
Look at the settings first, then the files, then the code. Keep the memory limit, the growth sizes and the data types honest. Find the heaviest reader before you tune anything else.
Run these three checks before you open a single plan. They take minutes. When you finish testing, remove the example database.
USE master;
GO
ALTER DATABASE ThreeMistakesDemo SET SINGLE_USER WITH ROLLBACK IMMEDIATE;
DROP DATABASE ThreeMistakesDemo;
A slow server is not a hardware problem, it is a question you have not asked yet.
Published by Pinal Dave on SQLAuthority. More of my work at pinaldave.com.
Discover more from SQL Authority with Pinal Dave
Subscribe to get the latest posts sent to your email.




18 Comments. Leave new
Database ‘test’ cannot be opened because it is offline.
Please bring that online to use script.
I do like your energy Pinal. I LOL about your wife making you coffee.
Just loved this one! Hats-off!
Thank you for your kind note.
Just gone through your video shared on this post. The complete knowledge shared by you is a learning lesson for me. Your time and efforts are highly appreciated.
Thanks Hetalkumar.
thanks for your share.
Thanks @sam
I really appreciate your Knowledge and information that you share , thank you so much
Thanks @Sachidanand
This contains valuable Information AND was fun to watch.
Awesome energy Sir and superb presentation…
Thanks A lot for highlighting our mistakes!!!
It was really really helpful session…
Thank you so much!
Thanks a lot Pinal Sir.
Great meeting you my friend!
Hi Pinal ,Thanks for the session .i cant find all scripts which you have used during this session
Hi Pinal, thank you for sharing parts of your know how. I enjoyed this video!