
I have seen a number of customers manage their SQL Server environments in an adhoc manner. These accidental DBA’s need to know what happened in the system in a chronological order or even worst need to know what led to the lead up to a particular problem. Many times when we troubleshoot a problem with high CPU, its asked that when it all started and do we have any historical data of CPU usage? Here is the one query which I have re-written to have more details. Let us see Query to Get CPU Usage History for SQL Server and Operating System.

DECLARE @ticks_ms BIGINT
SELECT @ticks_ms = ms_ticks
FROM sys.dm_os_sys_info;
SELECT TOP 60 id
	,dateadd(ms, - 1 * (@ticks_ms - [timestamp]), GetDate()) AS EventTime
	,ProcessUtilization as 'SQL CPU'
	,SystemIdle 'Idle CPU'
	,100 - SystemIdle - ProcessUtilization AS 'Others (100-SQL-Idle)'
FROM (
	SELECT record.value('(./Record/@id)[1]', 'int') AS id
	,record.value('(./Record/SchedulerMonitorEvent/SystemHealth/SystemIdle)[1]', 'int')
                          AS SystemIdle
	,record.value('(./Record/SchedulerMonitorEvent/SystemHealth/ProcessUtilization)[1]', 'int')
                          AS ProcessUtilization
		,TIMESTAMP
	FROM (
		SELECT TIMESTAMP
			,convert(XML, record) AS record
		FROM sys.dm_os_ring_buffers
		WHERE ring_buffer_type = N'RING_BUFFER_SCHEDULER_MONITOR'
			AND record LIKE '%<SystemHealth>%'
		) AS sub1
	) AS sub2
ORDER BY id DESC
My Test
I have run below query in SSMS from three connections.
SELECT *
  FROM [WideWorldImporters].[Purchasing].[PurchaseOrderLines] a
  , [WideWorldImporters].[Purchasing].[PurchaseOrderLines]  b
And here is what I saw as CPU usage history.
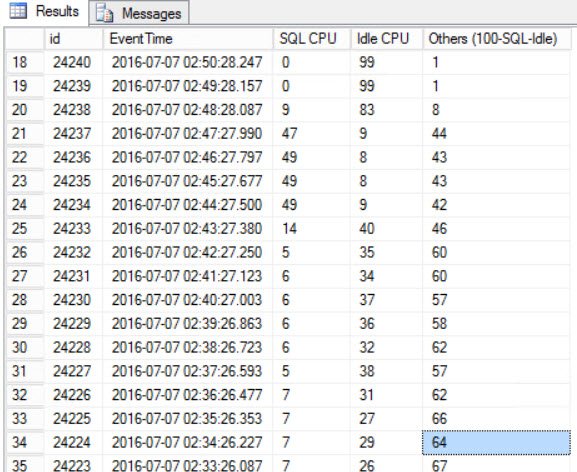
This alone would not help in finding what caused high CPU, but at least we have one more data point to dig further. These are a great way to explore and know how SQL Server is performing in a deployed system. I would be curious to know what tools and processes do you have for troubleshooting. Please let me know via comments below.
Published by Pinal Dave on SQLAuthority. More of my work at pinaldave.com.



13 Comments. Leave new
I use the DMV to identify the query which kept the highest CPU more than 3 minutes within SQL Server. The Performance Analysis of logs (PAL) does also help out to find out the resources issue.
This DMV would sometimes give inaccurate result where CPU utilization is more than 100 ;-)
I am still looking for an alternative for this as this has been working for long time until recently.
Please let us know if you have one in mind. Thanks.
The query does not return correct result where the value can be negative … I hope SP1 would fix sys.dm_os_ring_buffers
I truly hope so.
select highest_cpu_queries.plan_handle,highest_cpu_queries.
plan_generation_num,highest_cpu_queries.max_worker_time,
highest_cpu_queries.total_physical_reads,
highest_cpu_queries.total_logical_reads,
highest_cpu_queries.total_elapsed_time,q.[text],q.dbid,q.objectid,q.number,q.encrypted,query_plan
from (select top 50 qs.plan_handle,
qs.plan_generation_num,qs.creation_time, qs.execution_count, qs.total_worker_time,
qs.max_worker_time, qs.total_elapsed_time,
qs.max_elapsed_time, qs.total_logical_reads, qs.max_logical_reads,
qs.total_physical_reads, qs.max_physical_reads from sys.dm_exec_query_stats
qs order by qs.total_worker_time DESC)
as highest_cpu_queries
cross apply sys.dm_exec_sql_text (plan_handle) as q
cross apply sys.dm_exec_query_plan (plan_handle) as qp
order by highest_cpu_queries.total_worker_time DESC
Is it possible to get current SQL server CPU usage through a query ?
you can always query perfmon to get current data.
hello sir,
good evening, I am Lokesh (working as SQL-DBA L3). Sir, I want to know that what is meaning of 100 to count the syscpu i.e. in above SQL
“100 – SystemIdle – ProcessUtilization AS ‘Others (100-SQL-Idle)'” .
why we are using 100.
in my system I have 56 CPU i.e. 112 cores and applied this script but getting syscpu < sqlcpu, which is wrong. please help me out.
Regards
Lokesh Kumar
It is % of usage so it can only go max upto 100, hope this helps.
I also have a same issue, my server has 192 cores but when I run this query it’s appear wrong figures.
It is % of usage so it can only go max upto 100.
sys.dm_os_ring_buffers only stores the last 256 minutes of data. Is there a different location where several days of cpu performance data is stored?
Hello sir
Good day
As checked above quary show latest information. But I need to get information before date (like before 4 days before information need ) any query for that information
Please post that quary