One of my blog readers posted on Facebook asked following question about Huge Transaction Log:
Hi Pinal,
We are using AlwaysOn availability group for our production database. The database is fairly large in size as its around 260 GB. The database transaction log file grows around 2.5gb every day. Over the weekend the DBA team noticed that the Log file for this database bloated up to around 230 GB and then seems to hold steady. While troubleshooting I noted an error that the rebuild Index failed due to “Availability_Replica”. Here is the error which we saw in ERRORLOG
Error: 9002, Severity: 17, State: 9.
The transaction log for database is full due to ‘AVAILABILITY_REPLICA’
The question I have is what would be causing this log file to get so large, and is this normal behavior for a database in an Availability Group?
Thanks!
Here is my reply to him:
Thanks for asking such a wonderful question. Before I answer the questions, keep below in mind:
- Make sure that regular transaction log backups are taken to make sure it’s getting truncated on a regular basis. This is needed for any database which is in full or bulk-logged recovery model.
- Make sure you that replica in Sync otherwise the backup of transaction log would not truncate the log.
Coming back to the question: Yes, log-intensive transactions like modifying a large amount of data in tables or even rebuild of the index can cause the unusual log growth. This is because of the fact that the log cannot be truncated to redo has completed the changes in all secondary replicas of the availability group. The transactions like CREATE INDEX or ALTER INDEX are log intensive by nature. You cannot eliminate the log generation, but you can make intelligent maintenance to reduce the impact of the index rebuild on production activities.
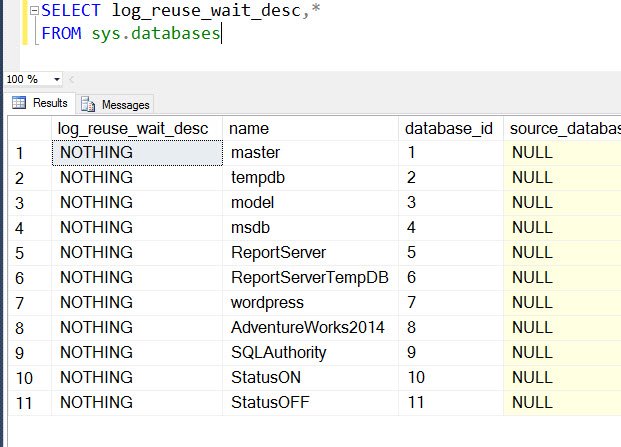
In general, you can, you following query which will show you what is preventing the log space reuse:
SELECT log_reuse_wait_desc,*
FROM sys.databases

Working with AlwaysOn Availability Groups can sometimes be very tough and tricky. Understand the basics and knowing the behavior can greatly improve our reasoning to why it behaves like this. Have you also encountered such situation ever in your environment? What did you do for that? Would love to hear from you on this for sure.
Reference: Pinal Dave (https://blog.sqlauthority.com)


5 Comments. Leave new
I’ve had the exact issue with index rebuilding and the deply between our production and DR sight. The only quick resolution for me was to remove our DR replica out of the availability group and take a transaction log backup. I then simply shrunk the log file back to its normal size.
Very useful script:
— last FULL backup
;with FULLBUs
as (
select d.name, max(b.backup_finish_date) as ‘Last FULL Backup’
from sys.databases d
join msdb.dbo.backupset b
on d.name = b.database_name
where b.type = ‘D’
group by d.name
),
— last LOG backup for FULL and BULK_LOGGED databases
LOGBUs
as (
select d.name, max(b.backup_finish_date) as ‘Last LOG Backup’
from sys.databases d
join msdb.dbo.backupset b
on d.name = b.database_name
where d.recovery_model_desc ‘SIMPLE’
and b.type = ‘L’
group by d.name
)
— general overview of databases, recovery model, and what is filling the log, last FULL, last LOG BKP
select d.name, d.state_desc, d.recovery_model_desc, d.log_reuse_wait_desc, f.[Last FULL Backup], l.[Last LOG Backup]
from sys.databases d
left outer join FULLBUs f
on d.name = f.name
left outer join LOGBUs l
on d.name = l.name
–where d.name not in (‘model’, ‘TempDB’)
order by name –‘Last log Backup’ DESC
I experienced the issue with a client who was running a SQL 2014 AlwaysOn cluster in Azure. The log repeatedly grew despite backups completing successfully. The database stayed Synchronized but the latency was extremely high and the redo queue kept growing despite no evidence of network or other bottlenecks. In addition to the error regarding the transaction log being full, the error 9012 was found in the SQL Error logs:
“There have been X misaligned log IOs which required falling back to synchronous IO. The current IO is on file”
We discovered that the instances were built with different Azure storage types. The primary had been built using Premium storage while the Secondary used Standard storage. The volumes have different sector sizes. SQL aligns the log’s boundaries to the local sector size. When the log is written to volume with a sector size different from the primary, the error is fired and the replica switches to Synchronous IO causing higher than expected waits and latency. This issue is not limited to virtual instances — it serves as a reminder to always build primary and secondary instances using identical hardware.
Fsutil fsinfo ntfsinfo confirmed the misaligned sector sizes. After applying CU5 for SQL 2014 and enabling trace flag 1800 the issue no longer occurred.
See https://support.microsoft.com/en-us/help/3009974/fix-slow-synchronization-when-disks-have-different-sector-sizes-for-pr for details.
Ran into this same issue today, I took the replicas out of the availability group, then shrink the log files and then add the replicas back to the availability group and made sure they are both in synch.
Does it matter if the secondary is in async or sync ?? If the secondary is shut down for over a day, would the log on primary truncate at all if it’s set to async mode!vTY