There are a lot of games that I play with my daughter in spare time. Some of them are for just for fun and a lot of them are fun filled with some learning. As she started to grow up, it was important for me to weave learning into her day-to-day activities. So as soon as she was born, one of the biggest decision I took was to travel and show her the various places in India and even abroad. The idea is to visit these places from fun point of view but also from an historic importance. Learning different cultures, people, places, food habits etc. she gets to learn a lot in that process. I personally feel it is up to each parent to find their own sweet spot of making learning fun for their kids while balancing all that they might do. It is a long process and a lot of planning goes behind making them realize what they see in the books is what they are visiting. I have huge admiration for the culture and history each country brings and we can always learn a lot from our ancestors.
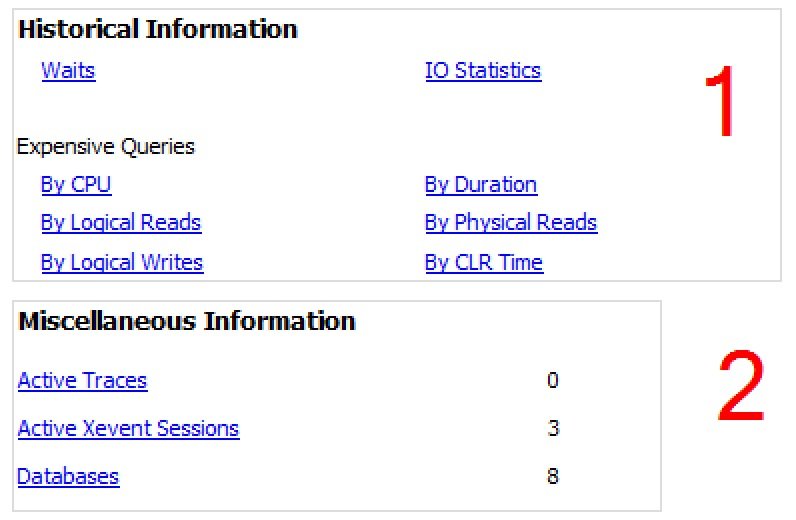
Talking about history bring us to the next set of reports from Performance Dashboard. They are grouped inside the Historical Information and Miscellaneous Information. They are logically grouped based on Waits and Expensive queries. We are looking at expensive queries based on:
- CPU
- Logical Reads
- Logical Writes
- Duration
- Physical Reads
- CLR Time
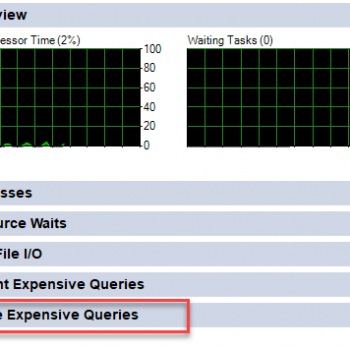
Apart from this the historical information also gives the Waits and IO Statistics across each of the databases. We can find the same in image below.
Historical Waits
This report has two sections and they are come from the same dataset. The top section is a bar-chart and the bottom is a details for the each.

The dataset for this report comes from msdb database.
EXEC msdb.MS_PerfDashboard.usp_DmOsWaitStats
Executing this gives a table of all the Waits and the amount of waits on each of them. Since I started the server and executed this report, we can see it has been idle for a longer time which is quite possible. Having said that, in a busy systems these can be completely different.
I have blogged about the Wait Stats extensively over this blog as a 28 part series – if you are interested, feel free to read the same from SQL SERVER – 28 Links for Learning SQL Wait Stats from Beginning.

Historical IO Report
This report is an aggregation of IO operations for each database since the server was started. Since this is IO, it compares relative to each database and compares them by Reads and writes. To get this information, the report makes a call to msdb database for the following SP.
EXEC msdb.MS_PerfDashboard.usp_DBFileIO
As we can see in the figure below, this is a great indicator in my server that the AdventureWorks2012 has taken maximum amount of Reads while my TempDB has suffered the maximum writes.
The patterns that emerge out of this tell me stories that we normally find it difficult to get. Based on this analysis we can assume that there are lot of reports or operations we are doing using AdventureWorks2012 and working them into Tempdb tables on our server. I am sure you will be able to analyze similarly on your installation box too.

The second section of the report shows the details of Top 20 objects for each database based on IO. For simplicity sake I have expanded the AdventureWorks2012 database for reference here.

Expensive Queries section
The next logical section we can see in the report are around expensive queries. They are the same data for each report but logically sorted based on CPU, IO, Reads, Writes etc. If we run profiler we can find the below query hitting our msdb database.
EXEC sp_executesql @stmt=N'exec msdb.MS_PerfDashboard.usp_QueryStatsTopN1 @OrderBy_Criteria',@params=N'@OrderBy_Criteria NVarChar(max)',@OrderBy_Criteria=N'CPU'
As mentioned above the same query gets fired with a different sort order. The top section shows a graphical bar chart of Top CPU consuming queries.

And as usual the second section outlines the details. In each case we can see the details of CPU, IO, and Reads etc. are also shown. This is marked in figure below.

On expanding each of the columns, we can also check the Total, Max, Min and Avg. for CPU, Duration, Physical Reads, and Logical Writes and so on.

Miscellaneous Reports
This contains a bunch of reports that are like addendum to already available reports. The one that is additional and worth a mention are the XEvents Session report.
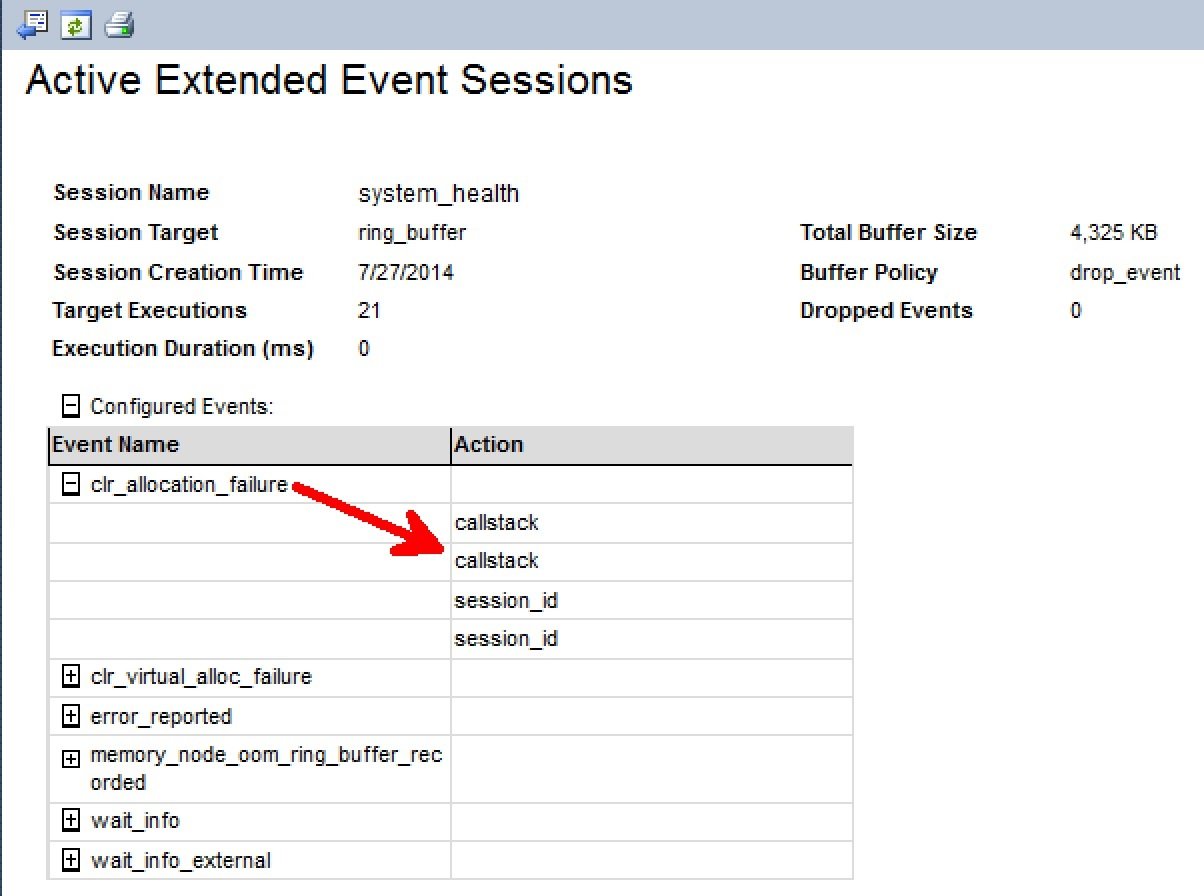
XEvents are a deeper topic to understand. You can learn a primer from SQL SERVER – Introduction to Extended Events – Finding Long Running Queries. Fundamentally, the report shows the active running Xevents on the server at this moment of time. As you might have guessed by now, the report calls an SP from MSDB database to fillup the contents.
EXEC msdb.MS_PerfDashboard.usp_XEventSessions
End of the day these joining various DMVs to get the output. Like in this case the report uses sys.dm_xe_sessions, sys.dm_xe_session_targets and sys.dm_xe_session_event_actions to get values. As we have said a number of times before, the power of DMVs are always underestimated when working with SQL Server.
Another very important link is about Active Traces. To demonstrate the power of this report, I have started a profiler trace on SQL instance. Trace ID 1 is the default trace which runs with every default installation of SQL Server and many standard reports are dependent on that.
Trace ID 2 in below report has some warning:
- Rowset trace: client/GUI traces can negatively impact server performance.
- This trace is configured to capture one or more frequently occurring events or events which typically produce a large amount of trace data; tracing these events may negatively impact system performance. The expensive events are highlighted in yellow in the table below.

As we can see below that this report displays a warning for any trace that is configured to capture events which are frequently occurring or that typically produce a large amount of trace data. It is advisable to avoid capturing these events unless strictly required to prevent potential performance problems on the system, generally on non-production server when you are troubleshooting some particular issue. If we click on (+) symbols, we can see events captured by trace and it would also highlight the expensive events.
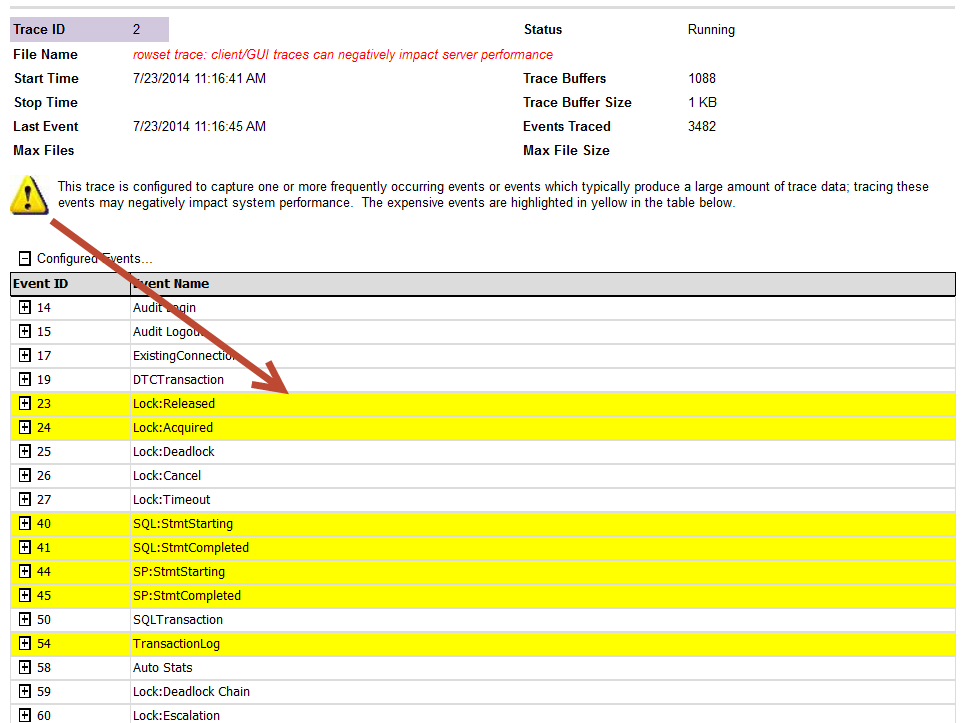
Here is the list of events which are “expensive” and would be highlighted in Yellow automatically.
Lock:Released
Lock:Acquired
SQL:StmtStarting
SQL:StmtCompleted
SP:StmtStarting
SP:StmtCompleted
Scan:Started
Scan:Stopped
TransactionLog
Showplan Text (Unencoded)
Showplan Text
Showplan All
Showplan Statistics Profile
Audit Statement Permission Event
Audit Schema Object Access Event
Showplan XML
Showplan XML Statistics Profile
Audit Database Object Access Event
Ideally, we should use server side traces. I have seen common misconception about client side and server side trace. People think that if they run profiler UI on server itself, it is called as server side trace which is WRONG. Trace using profiler.exe is called as Rowset-based trace or client side trace, which consumes more resources than tracing directly to a file. I would recommend my readers to use a server side trace writing directly to a fast disk to minimize the performance impact. We can use the Profiler user interface to configure the events and columns you want to capture and save that those setting to a script by choosing Export – Script Trace Definition under the File menu option.
Reference: Pinal Dave (https://blog.sqlauthority.com)




2 Comments. Leave new
I can’t see what report it comes from, please sugest, I am using SQL server 2008 R2 with SP2 and CU4.
Hi I have centralised these, let me know what you think https://archive.codeplex.com/?p=sqldashboards