
You are driving on the highway and you want to know your speed because there are cops generally in that areas – you watch the dashboard. Your kid seems to be fiddling with your cell phone – you want to see what they are doing actually and not accidentally making any calls to your office colleagues. You walk into your hall and see an ad going on the TV, you want to know what channel it is. All these are classic examples of understanding your current state for the activity in hand. There are surely a number of ways to achieve the same. I am sure you get the drift.
This section of Performance Dashboard is no different. It will give you a glimpse to current activity happening on the system. At a high level they are divided into User requests and User Sessions and the various vital parameters. They are taken from DMVs sys.dm_exec_requests and sys.dm_exec_sessions respectively.

As discussed in our previous post, it is vital to track the Cache Hit Ratio and this needs to be on the high 90’s as much as possible for an OLTP system. There are two hyperlinks that give us even more detailed information about the current system.
Clicking on “User Requests”, we will be presented by the “Current Requests” report. This is the current live report on the requests in queue in our system at this very moment of time.

There are a number of Columns that get reported in this one output. For image restrictions, there is only a part shown above. The complete list of columns available are:
- Session ID: Request ID
- Start Time
- Query Text
- Status
- Wait Type
- Wait Time (ms)
- Wait Resource
- Blocking Session ID
- CPU Time (ms)
- Total Elapsed Time
- Logical Reads
- Physical Reads
- Writes
- Transaction Isolation Level
- Granted Query Memory (KB)
- Executing Managed Code
We have capability to sort the result-set by columns by clicking on column name itself. Under the cover, this reports is fetches using a stored procedure in msdb database (created while deploying Dashboard Reports). Here is what you can run
EXEC msdb.MS_PerfDashboard.usp_RequestDetails 0
Second parameter is @include_system_processes means we don’t want to see system processes.
Each of these queries on the “Query Text” column are a hyperlink and can give us more detail when clicked. Below is the output wherein we get the Query Text, Query Plan, Showplan XML and some vital parameters required for the query. These can also be got from our “Execution Plan” and the “Properties” pane for a query.
We can also get this information using DMVs, for example the plan can be got from sys.dm_exec_text_query_plan() passing the SQL Handle.
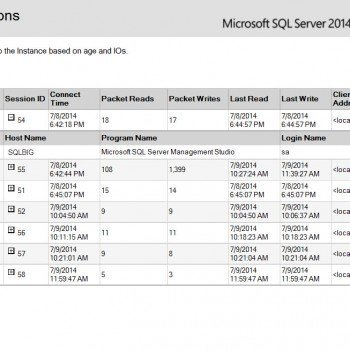
The next section to look at is the “User Sessions”. If we click on it, we will be presented with all the session currently active on our live system. This report is fetched by running below procedure
EXEC msdb.MS_PerfDashboard.usp_SessionDetails @include_system_processes = 0
Remember, Performance Dashboards Reports are great to understand what is happening in our system at that moment of time. They are not to be seen as proactive reports. As a DBA, if they want to quickly check on the vital parameters in the system interactively, then this is the place to go.
As you can see in the output, the “Sessions Overview” report gives us the active sessions with CPU, Memory usage, Logical Reads, Physical Reads, Writes, Program running on that session, NT User Name and more. A part of this information is already available if we use Activity Monitor, but I sort of like this output because it is not continuously running or refreshing.

Clicking on the Session ID hyperlink or this can also be invoked by clicking on the “Session ID: Request ID” hyperlink in our “User Requests” hyperlink which we discussed earlier in this blog post. Both lead us to the “Session Details” page.

For the given session and the query under question, we will get to know the session ANSI settings, Login Name, Login Time, NT User, CPU & Memory usage, when the last request was fired and many more. I am sure, you will not be able to get this information from other standard reports so easily. So try to use it wherever it might help you.
As discussed above, we can get the top section of the values using DMV query as:
SELECT session_id, login_time, HOST_NAME, program_name, login_name, nt_domain, nt_user_name, status, cpu_time, memory_usage, total_scheduled_time, total_elapsed_time, last_request_start_time,

last_request_end_time, reads, writes, logical_reads,

is_user_process, TEXT_size, language, date_format, date_first,

quoted_identifier, arithabort, ansi_null_dflt_on,

ansi_defaults, ansi_warnings, ansi_padding,

ansi_nulls, concat_null_yields_null,

transaction_isolation_level, lock_timeout,

deadlock_priority, row_count, prev_error

FROM sys.dm_exec_sessions
Quick Tips about Dashboard Reports
- We can always use back button available on the top of each report (highlighted below).
![]()
- The client report viewer control used by SSMS does not support Copy (Ctrl+C and Ctrl+V). The workaround of this would be to right click on the report and choose “export to Excel”. Once you open the exported file we can copy the text.
This is just a sample to how powerful some of the DMV’s are. They have tons of information that go un-noticed by us. Hope you will start using these DMVs effectively in future.
Reference: Pinal Dave (https://blog.sqlauthority.com)


1 Comment. Leave new
Hi,
Is that possible to check when a particular column has been modified in a table?