
PERCENTILE_DISC selects an observed value rather than inventing an interpolated value between observations. I use it when the result must belong to the supplied population. The ordering and percentile still need an explicit contract.

Define the ordered observations first
The example supplies six present decimal observations and one missing value. The present values are ten, ten, twenty, forty, one hundred and one hundred twenty. The repeated ten remains part of the population.
The window expressions request the twenty-fifth, fiftieth and seventy-fifth percentiles. Two additional expressions request the endpoints zero and one. Every expression uses ascending ordering of the same Value column.
The input column is explicitly decimal(8,2). That preserves a typed numeric source rather than sorting numeric-looking text. The type also gives the observed-value result a clear scale contract.
I keep the complete input list small enough to sort by inspection. The repeated value and the wide gaps make the selected observations meaningful. A sequence of consecutive numbers could hide what the operation actually selects.
WITH Observations AS
(
    SELECT CAST(Value AS decimal(8,2)) AS Value
    FROM (VALUES (CAST(10 AS decimal(8,2))),(10),(20),(40),(100),(120),
        (CAST(NULL AS decimal(8,2)))) AS v(Value)
), Percentiles AS
(
    SELECT
        PERCENTILE_DISC(0.25) WITHIN GROUP (ORDER BY Value) OVER () AS P25,
        PERCENTILE_DISC(0.50) WITHIN GROUP (ORDER BY Value) OVER () AS P50,
        PERCENTILE_DISC(0.75) WITHIN GROUP (ORDER BY Value) OVER () AS P75,
        PERCENTILE_DISC(0.00) WITHIN GROUP (ORDER BY Value) OVER () AS PZero,
        PERCENTILE_DISC(1.00) WITHIN GROUP (ORDER BY Value) OVER () AS POne
    FROM Observations
)
SELECT DISTINCT P25,P50,P75,PZero,POne,
    CAST(SQL_VARIANT_PROPERTY(CAST(P25 AS sql_variant),'BaseType') AS nvarchar(128)) AS ResultType,
    CAST(SQL_VARIANT_PROPERTY(CAST(P25 AS sql_variant),'Scale') AS int) AS ResultScale
FROM Percentiles;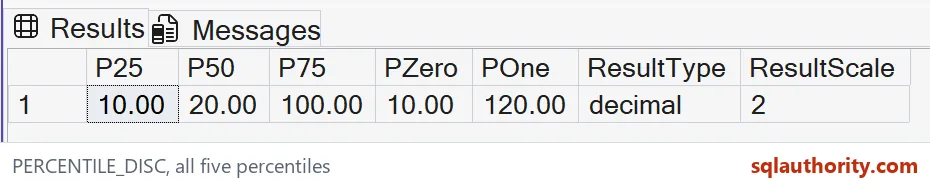
Read discrete positions through the population
The expected twenty-fifth percentile is ten. The repeated ten occupies the first two positions of six present observations. Its cumulative share already reaches the requested threshold.
The expected fiftieth percentile is twenty. Three present observations have been reached at that value. The function does not average twenty and forty to create a new observation.
The expected seventy-fifth percentile is one hundred. Four of six observations through forty are still below that share. Reaching the fifth observation crosses the requested threshold.
These selected values are all members of the supplied data. A continuous percentile can answer an interpolation question instead. Choosing between the methods is about the required meaning, not which displayed number looks smoother.

Keep missing values and duplicate values separate
The missing input is ignored for the percentile calculation. It does not become a seventh ranked value of zero. The complete present population still contains six observations.
The duplicate ten is not ignored. Removing duplicates before the calculation would define a different population. An observation list and a list of unique values answer different distribution questions.
I’d preserve repeated observations when each represents a real measurement or event. A duplicated import record could instead be an upstream quality problem. The percentile function does not decide which interpretation the data deserves.
The final SELECT DISTINCT reduces identical window outputs to one displayed row. It does not deduplicate the observations before the window functions run. Keeping those steps in separate query layers makes the distinction visible.
Check endpoint and type requirements
The expected zero-percentile endpoint is ten, while the one-percentile endpoint is one hundred twenty. Those values confirm the ascending direction. Reversing the ordered expression would change the requested distribution interpretation.
The expected ResultType is decimal, and ResultScale is two. PERCENTILE_DISC returns the type of its ordered expression. This differs from returning an approximate interpolated numeric type merely because a percentile was requested.
The SQL Server syntax includes OVER even when no partition is specified. That treats the supplied rowset as one population. Partitioning by a real group would calculate its percentile from that group’s observations instead.
The selected percentile values belong to the supplied observations. Their thresholds describe positions in the ordered population of present readings. Choose the percentile requirement before deciding whether an observed value is the appropriate output.
When adapting it, keep ties, missing input and at least one wide value gap. Write the expected observed threshold before execution. Those cases reveal accidental deduplication or interpolation that a neat consecutive list could conceal.
Write the expected value first, then run the query and compare.
An observed percentile is not a midpoint, it is a value you actually supplied.
Published by Pinal Dave on SQLAuthority. More of my work at pinaldave.com.
Discover more from SQL Authority with Pinal Dave
Subscribe to get the latest posts sent to your email.


