A year-to-date total is only fair when you put it next to the same period last year. I still see dashboards that set August’s running total beside a full twelve months and then wonder why everyone looks gloomy. Here is the honest version, in one query.

Same period means the same dates
Picture a Friday afternoon in mid-August. A manager walks over and asks, “Are we ahead of last year?” Year-to-date means January 1 through today. The fair partner is January 1 through the same calendar day last year. Two date ranges, one table, no tricks.
Build a small sales table
One row per day, from January 1, 2024 through August 31, 2026. The amounts follow a simple pattern with a little growth each year, so the numbers you get will match mine. The temp table vanishes when you close the window.
DROP TABLE IF EXISTS #DailySales;
CREATE TABLE #DailySales (SaleDate date NOT NULL PRIMARY KEY, Amount int NOT NULL);
INSERT #DailySales (SaleDate, Amount)
SELECT d.SaleDate, 100 + (g.value * 7 % 23) + (YEAR(d.SaleDate) - 2024) * 10
FROM GENERATE_SERIES(0, DATEDIFF(DAY, '2024-01-01', '2026-08-31')) AS g
CROSS APPLY (SELECT DATEADD(DAY, g.value, CAST('2024-01-01' AS date)) AS SaleDate) AS d;
Two sums in one pass
Set the as-of date once. From it, work out the start of this year, the start of last year and last year’s matching day. Then let two CASE expressions each add up their own range. You get one scan and one result row.
DECLARE @AsOf date = '2026-08-15';
DECLARE @ThisStart date = DATEFROMPARTS(YEAR(@AsOf), 1, 1);
DECLARE @LastStart date = DATEADD(YEAR, -1, @ThisStart);
DECLARE @LastAsOf date = DATEADD(YEAR, -1, @AsOf);

SELECT YtdThisYear, YtdLastYear,
       CAST(100.0 * (YtdThisYear - YtdLastYear) / NULLIF(YtdLastYear, 0) AS decimal(6, 1)) AS PercentChange
FROM (SELECT SUM(CASE WHEN SaleDate BETWEEN @ThisStart AND @AsOf THEN Amount END) AS YtdThisYear,
             SUM(CASE WHEN SaleDate BETWEEN @LastStart AND @LastAsOf THEN Amount END) AS YtdLastYear
      FROM #DailySales
      WHERE SaleDate BETWEEN @LastStart AND @AsOf) AS t;

SELECT SUM(Amount) AS FullLastYear FROM #DailySales WHERE YEAR(SaleDate) = 2025;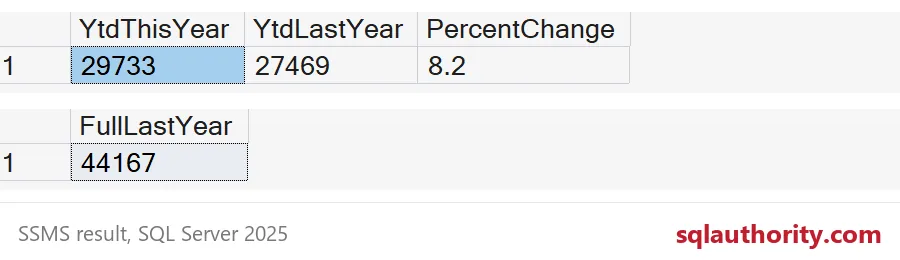
By August 15, 2026 the business has sold 29,733. By the same day in 2025 it had sold 27,469. That is up 8.2 percent. The NULLIF in the divisor is a habit worth keeping, and I wrote about it in NULLIF Denominators: Keep Zero and Missing Values Visible.
Now the tempting mistake. The second query shows all of 2025 closed at 44,167. Compare 29,733 against that and this year looks about 32.7 percent behind. Same business, same sales, a completely different mood. Someone will schedule a meeting.

The leap day gets a vote
DATEADD with a negative year handles the calendar for you. March 1, 2025 steps back to March 1, 2024. But 2024 had a February 29, so through March 1 this year has 60 days of sales and last year has 61. The query below counts them.
DECLARE @AsOf date = '2025-03-01';
SELECT COUNT(CASE WHEN SaleDate BETWEEN '2025-01-01' AND @AsOf THEN 1 END) AS DaysThisYear,
       COUNT(CASE WHEN SaleDate BETWEEN '2024-01-01' AND DATEADD(YEAR, -1, @AsOf) THEN 1 END) AS DaysLastYear
FROM #DailySales
WHERE SaleDate BETWEEN '2024-01-01' AND @AsOf;

SELECT DATEADD(YEAR, -1, CAST('2028-02-29' AS date)) AS LastYearDate;
The comparison is still the right one. Just print the day counts beside the totals when the as-of date falls after a leap day, so nobody has to ask. The second query shows the quirk in the other direction. Step back one year from February 29, 2028 and you land on February 28, 2027. Nothing breaks, so nothing warns you.
Month by month, side by side
Dashboards usually want one row per month. Total each month once, join every 2026 month to the same month of 2025, then run a cumulative SUM over the month number. I spell out ROWS UNBOUNDED PRECEDING so the total adds one row at a time. The reasons are in ROWS vs RANGE in Window Frames: Why Running Totals Differ.
WITH m AS (
    SELECT YEAR(SaleDate) AS Yr, MONTH(SaleDate) AS Mo, SUM(Amount) AS MonthTotal
    FROM #DailySales
    GROUP BY YEAR(SaleDate), MONTH(SaleDate)
)
SELECT t.Mo AS MonthNumber,
       SUM(t.MonthTotal) OVER (ORDER BY t.Mo ROWS UNBOUNDED PRECEDING) AS Ytd2026,
       SUM(l.MonthTotal) OVER (ORDER BY t.Mo ROWS UNBOUNDED PRECEDING) AS Ytd2025
FROM m AS t
JOIN m AS l ON l.Mo = t.Mo AND l.Yr = t.Yr - 1
WHERE t.Yr = 2026
ORDER BY t.Mo;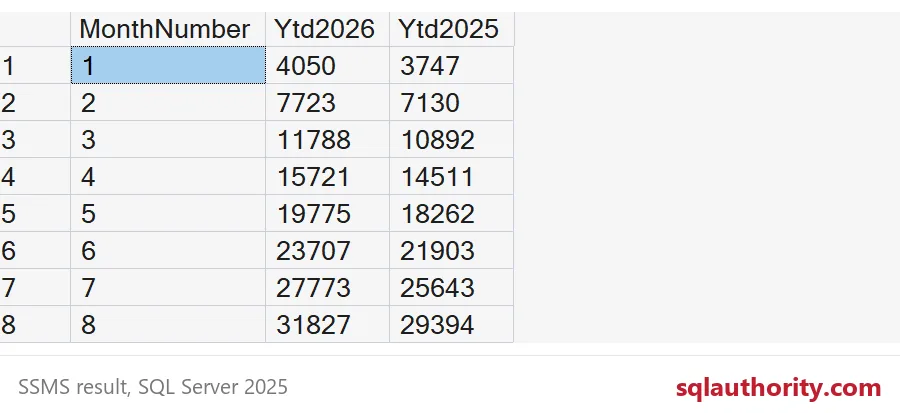
My data ends on August 31, so every month is complete. August closes at 31,827 for 2026 against 29,394 for 2025. If your current month is still in progress, use the as-of query instead. A half month beside a full month is the same mistake in a smaller coat. To check your own server, pick one month and add it up with a plain SUM and a WHERE. If the numbers disagree, a boundary is off by a day.
DROP TABLE IF EXISTS #DailySales;Next time someone asks if you are ahead of last year, you will have the number and the day count ready.
A year-to-date number is not a verdict, it is half of a comparison.
Published by Pinal Dave on SQLAuthority. More of my work at pinaldave.com.
Discover more from SQL Authority with Pinal Dave
Subscribe to get the latest posts sent to your email.