I don’t know where to start, I get to learn things from the most unusual of places. Most of the learnings is based on challenging the statuesque of our understanding. During my interactions with various DBAs one of the common misunderstanding is about server side and client side trace. One of the answer which I commonly hear is “When SQL server profiler is run directly on server, it is called server side trace. When we run on client computer, it’s called client side trace” – this is NOT true.
In this blog, I would try to explain them in little detail.
Client Side Trace
SQL Server Profiler provides user interface with the easy way to choose the required events and adding filters to capture less data. When SQL Server Profiler is run to connect to SQL instance and capture the trace – it is called as client side trace. Even if the profiler is running on server itself, it is client side tracing. Whenever the event is raised in SQL Engine (like statement completed, RPC completed etc.) the data is sent to client which is running profiler and data is shown in the UI. This is also called as rowset trace.
Server Side Trace
Server Side trace process runs on the server and collects the trace data in the similar fashion as profiler but captured using T-SQL scripts. There are system level extended stored procedures to start, stop, pause, filter and they are named as sp_trace*. Below are few of them.
sp_trace_create
sp_trace_setstatus
sp_trace_setevent
sp_trace_setfilter
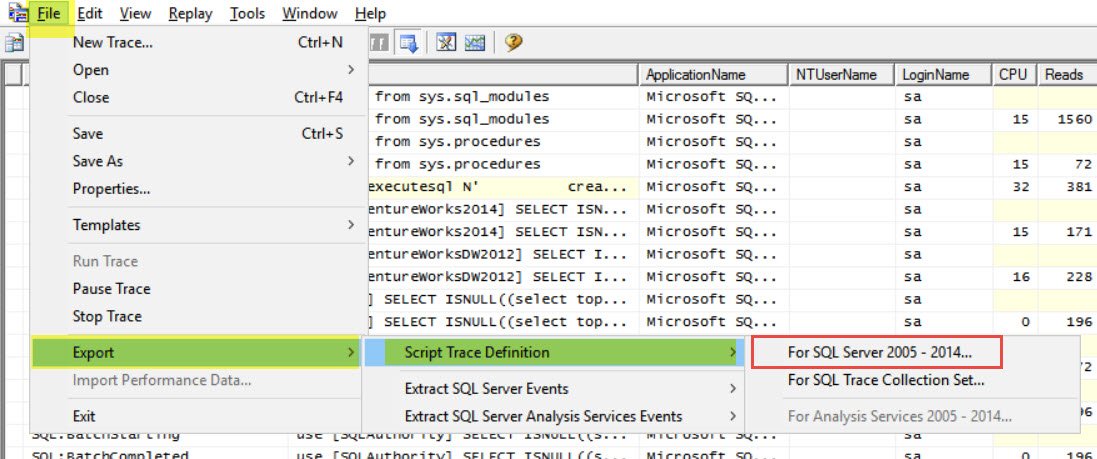
The easiest way to generate the script is to use a profiler itself. To do that, first start a profile on any server by choosing required events, filters etc. Then use “Script Trace Definition” option as shown below.

Once script is generated, it can be used to any of SQL instance and executed in SSMS. This would create server side trace and capture the data in the location provided in the script.
/*Server Side*/

SELECT *

FROM   sys.traces

WHERE  is_rowset = 0

/*Client Side*/

SELECT *

FROM   sys.traces

WHERE  is_rowset = 1

Below are few disadvantages on client side trace when captured on a busy production server.
- Performance hit.
- Risk of dropping event and missing the data which might have been helpful.
To summarize, if you are trying to solve a performance issue on a busy production SQL server, don’t use profiler trace at all. Do let me know about your experience and it can be a great learning for readers too.
Reference: Pinal Dave (https://blog.sqlauthority.com)


1 Comment. Leave new
Pinal, Thank you for your great blog resource. It has helped me on many occassions. When you say “don’t use profiler trace at all” do you mean not to use Client-Side trace? Or do you mean to use something else like extended events to capture performance metrics?