Most of the blog post as I say is revisiting something I wrote a while back in this blog. Recently one my blog readers asked me about user defined counters and he seems to have bumped into the blog: How to use Procedure sp_user_counter1 to sp_user_counter10 and was thinking if there is a way to play with these counters for some debugging purposes.
Well, the debugging capabilities of SQL Server are completely awesome since SQL Server 2012, this particular question got me thinking. So I thought let me write something simple to show you how some of these hidden gems are worth a look again.
Introducing sp_trace_generateevent
This is a simple command that allows to create user defined events inside SQL Server. We can raise an event with event id between 82 and 91 (total of 10 events). The usage of the same is simple – use the TSQL:
SELECT 1
GO
EXEC MASTER..sp_trace_generateevent
@event_class = 82, @userinfo = N'This is post SELECT 1 :)';
In the above code block, we execute the SELECT and post it executes – we want to raise an event. So your next obvious question is how do we capture the same? We will turn up to our old friend SQL Server Profiler.
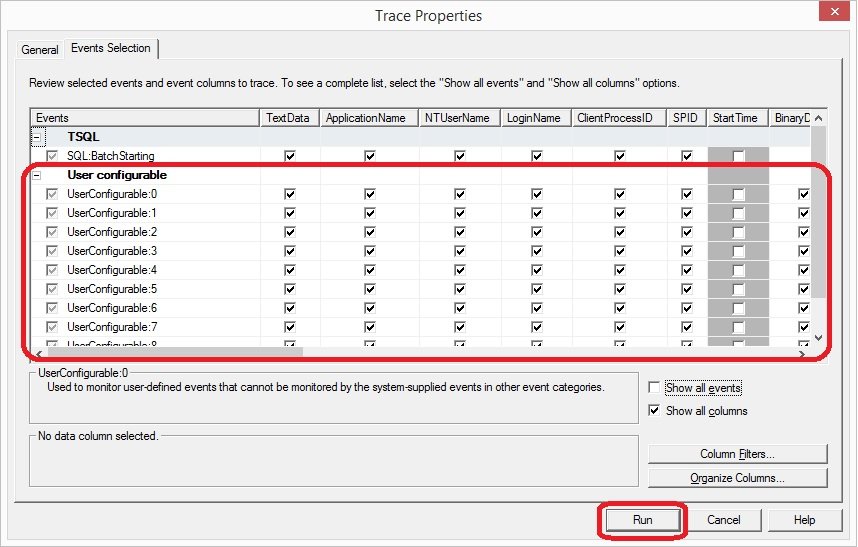
So as part of event selection, we will go ahead and select the appropriate event:

Since we have used Event ID of 82 – it gets collected under UserConfigurable:0. So the guess is simple:
Event ID: 82 -> UserConfigurable:0
Event ID: 83 -> UserConfigurable:1
Event ID: 84 -> UserConfigurable:2
…
…
Event ID: 91 -> UserConfigurable:9
Now let us next look at our event output from Profiler.

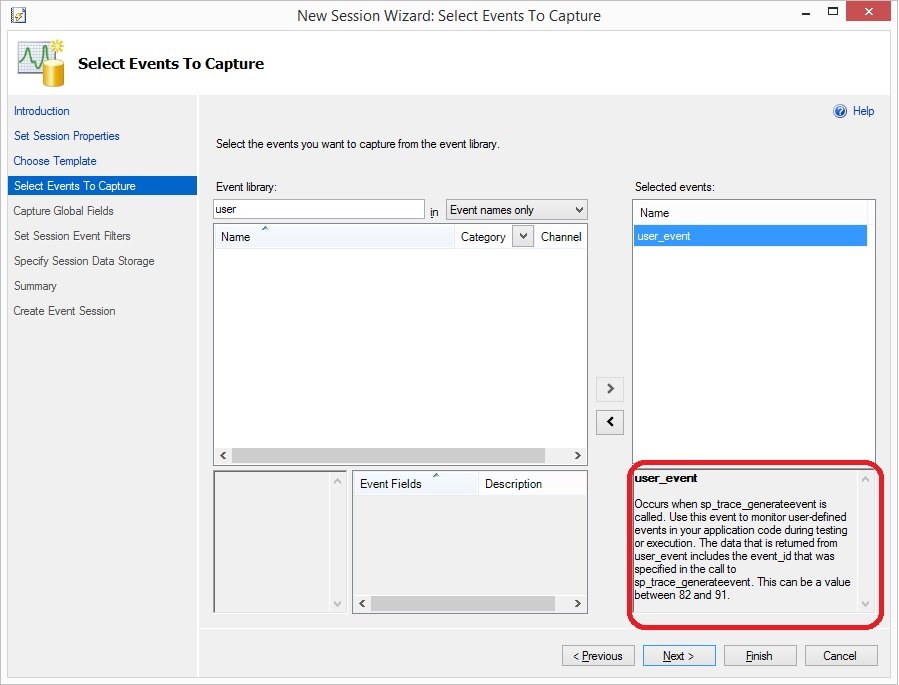
Now, we can use the various event ID to raise a user configured event. This is not the ONLY way to capture user configurable events. We can also use Extended Events to capture the same. If you go through the Extended Events Wizard, make sure to select the “user_event” Event name just like below:

Go through the wizard and finish. Or feel free to use the below TSQL:
CREATE EVENT SESSION [User-Generated-Event] ON SERVER
ADD EVENT sqlserver.user_event
ADD TARGET package0.event_file(SET filename=N'C:\Temp\User-Defined-Event.xel',max_file_size=(20))
WITH (STARTUP_STATE=ON)
GO
Once this is created, we can use the Extended Events node to right click and “Watch Live Data”.
These are simple yet powerful ways to watch data when it comes to using User Configurable Events. Have you ever tried using them in your environments? Would be interesting in learning the same from you if you can share via comments.
Reference: Pinal Dave (https://blog.sqlauthority.com)


4 Comments. Leave new
hi dave
please help me for performance counter prefer values i dont know what the values of given bellow performance counter objects
Memory
Parameter
Total memory=
SQL Cache Memory=
Lock Memory=
Optimizer Memory=
Connection Memory=
Granted WorkSpace Memory=
Memory Grants Pending=
Memory Grants Success=
Cache Details:
Cache Hit Ratio=
Cache Used/Min=
Cache Count=
Cache Pages=
Scheduled Jobs:
Job Status=
Run date & time=
Job Time=
Retries Attempted=
The above objects are performance counter objects pls help me and tell me what is the best value of those objects
I am using sql server 2008
Thank u advance
What is the exact problem you are facing?
i have to plan to assign best prepare value for those parameters for server optimize work
1. Higher cache hit ratio is good.
2. Memory is depending upon the environment and workload.
3. For “Scheduled Jobs:” you can use your own judgment.