
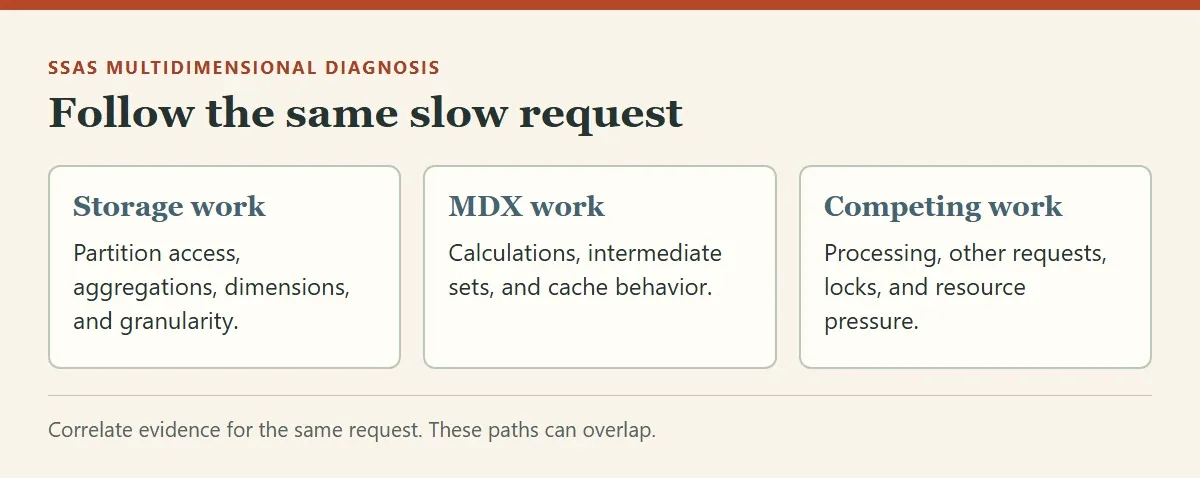
SSAS cube performance can change suddenly even when yesterday’s report was fast. I start by proving where the time goes. Then I separate storage work, MDX calculations, and competing activity before choosing a fix.
These checks concern SQL Server Analysis Services multidimensional cubes and MDX. They do not describe relational GROUP BY CUBE or a tabular DAX model.
First Prove the Cube Is Slow
Capture the report’s exact request, parameters, user identity, and time window. Compare its end-to-end time with the time spent inside Analysis Services. Check reporting, network transfer, rendering, and concurrency before blaming the cube. A slow dashboard alone does not identify a slow storage engine.
Then reproduce the same request against the same cube version and data. Record whether it is the first run or a repeated run. Security context and parameters belong in the comparison. A different user or date range can change both results and work.
List what changed since the known fast run. Check processing, deployment, partition growth, calculations, service restarts, user load, and overlapping maintenance. Keep the timeline beside the request. The first useful finding is a reproducible symptom, not a hardware purchase.
Trace One Request Carefully
Use an Analysis Services connection in SQL Server Profiler to investigate the cube. Useful events include Query Begin, Query End, command, and lock events. Capture the relevant query text and context. Narrow the collection to the database, session, and interval under investigation.
For storage questions, review Query Subcube, Get Data From Aggregation, and Get Data From Cache events. Use Query Subcube Verbose only when its extra detail is needed. Several detailed events add overhead. A broad, verbose production trace can disturb the workload being investigated.
Save the trace and the exact query together. Correlate events for the same request and compare repeated executions. Do not subtract accumulated subcube durations from elapsed time and label the remainder formula-engine time. Overlapping work and event scope need interpretation.
Follow the Storage Engine
Start by examining storage-engine work. Check which partitions and aggregations the request uses. Inspect dimension design and the query’s granularity. A larger detailed result can require different work from a small summary, even against the same cube.
Compare the actual query patterns with partition boundaries and aggregation design. Confirm that required partitions were processed and contain the intended data. Partition storage and aggregation design are separate properties. An aggregation existing somewhere does not prove that this request used it.
Look for a changed partition slice, unexpected volume, or a dimension relationship that no longer matches the model. Validate the facts and relationships before changing aggregation settings. Extra precomputed summaries consume processing time and storage. I would test a targeted design against the queries it must improve.
Follow the MDX Calculations
Next examine the query processor. Review the MDX request, calculated members, and calculation script. Compare a controlled version that removes one expensive calculation while keeping the requested data scope clear. A faster query returning a smaller question is not an equivalent fix.
Record memory, CPU, and disk activity during the same request. Inspect whether a large intermediate set or detailed output explains the work. Repeat the request under a known cache condition. A fast repeated run deserves investigation of cache reuse and startup behavior.
I would use cache warming only after measuring the real first-run requirement and competing workload. Warming every possible report is another workload to maintain. Do not clear a shared production cache to manufacture a comparison.
Check Processing and Competing Work
Compare the slow interval with processing commands and other active requests. Look for waits or lock events around model changes. Check whether the same request becomes fast during a quieter interval. That distinction helps separate an expensive query from contention affecting an otherwise stable query.
Investigate whether hardware limits the request. CPU pressure, memory pressure, or slow storage are observations to correlate with the request. They are not automatic instructions to scale up. Confirm whether the resource limit persists after addressing avoidable query or model work.
I would also check whether a restart or processing changed the cache state. Keep those events visible in the timeline. Comparing a cold run after processing with a warm run from yesterday can hide the real reason. Match conditions before claiming improvement.
When the Underlying Tables Matter
Source-table maintenance needs its own evidence. The answer depends on partition storage and processing behavior. The storage mode matters: ROLAP uses relational detail and aggregations, while HOLAP keeps relational detail with multidimensional aggregations.
With MOLAP, processed detail and aggregations are stored in multidimensional form. Source-table work still matters during processing. It does not explain every slow MDX query against already processed MOLAP data. Trace the observed source access before recommending relational index or statistics maintenance.
If a query or processing step reaches the relational source, investigate that request there as well. Check its plan, data volume, waits, and maintenance needs. Keep source processing time separate from cube query time. Rebuilding source indexes without evidence can add work without fixing the reported delay.
Change One Cause and Check the Answer
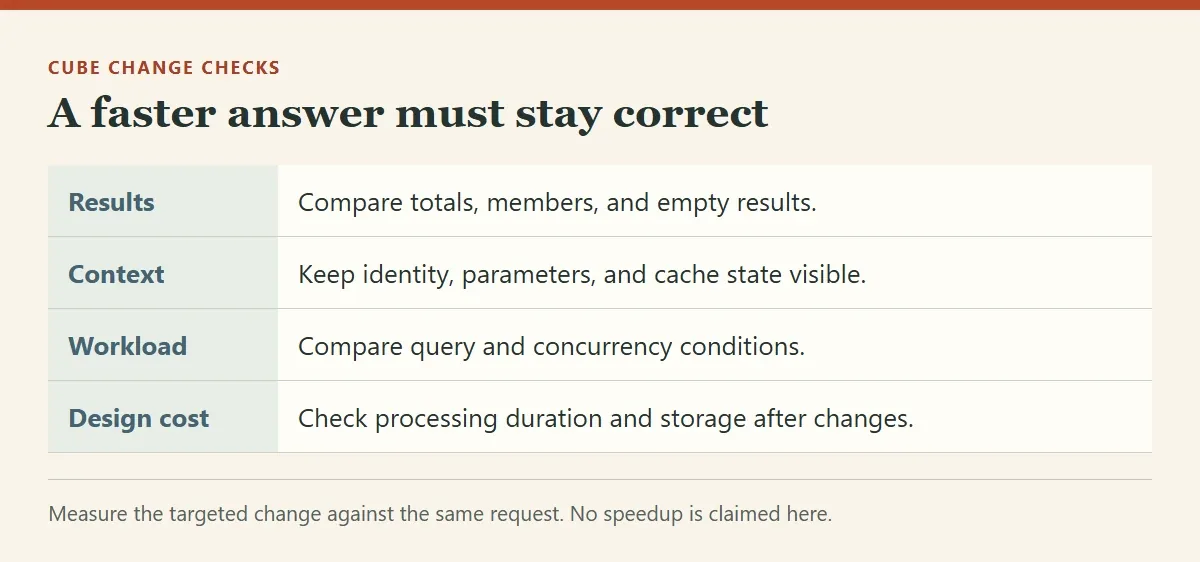
Choose a change supported by the evidence: query refinement, corrected relationships, partition design, aggregation design, or workload scheduling. Test it with the original request and the same relevant conditions. Record elapsed time and result equality. Keep a rollback plan for model changes.
Validate totals, member selections, security behavior, and empty results after a change. Also check processing duration and storage cost if the design changed. A report that runs faster with missing members is a broken report. This diagnostic guide claims no measured speedup from a test cube.
Take it one request at a time and the slow spot usually shows itself.
Cube performance is not a hardware guess, it is a request followed through its actual work.
Published by Pinal Dave on SQLAuthority. More of my work at pinaldave.com.
Discover more from SQL Authority with Pinal Dave
Subscribe to get the latest posts sent to your email.




1 Comment. Leave new
The top 2 areas to start cube diagnose for perf issues would be as follows:
(assuming that you have already checked the user load, reporting layer, and any other intermendiate layer and now you are sure that reports / results are slow due to cube):
1. Check storage engine (aggregations hits or cube partition hits or fact table hits)
2. Check query processor (query is formula intensive, many calculations, lots of memory used)
Coming to the specific questions you asked above:
Q: How to reach to root of slow performance?
A: Follow the cube perf diagnosis manually + w/ help of SSAS Profiler:
1. Storage engine – This involves checking/improving the cube structure
1.1 Check if cube dimensions are optimized
1.2 Check if your query is hitting the aggregation store
1.3 Check if cube partitions are optimized for the query patterns (which are in use)
2. Query processor – this involves checking/improving the MDX queries
2.1 Check if MDX queries are optimized
2.2 Check if cache warming is required for specific long running queries
2.3 Check if queries are using lots of memory (RAM) – Memory intensive, lots of data required to perform aggregations/calculations on the fly
2.4 Check if queries are using lots of processor power (CPU cycles) – CPU intesive, lots of calculations
2.5 Check if there is lots of disk activity going on during query execution – IO intensive
By performing above steps you will reach to the root/closer to the problem.
Q; Is hardware causing the problem or something else?
A: You will get to know after performing above diagnosis based on whether query is Memory intensive, CPU intensive or IO intesive you can accordingly sacle-up
Q: Is slowness is due to how cube is build and its granularity?
A: You will get to know after steps mentioned in section#1 above
Q:Is underlying tables require maintenance?
A: Might be required, when queries are hitting fact tables for data retrieval and on the fly aggregations , especially in case of ROLAP partitions
Q: Is there is chance to refractor the process?
A: Yes, there are tools available to see the complete MDX query map (internal working) and also SSAS profiler is helpful
Q: Are there any tool which can help diagnosis the slowness of the cube?
A: SSAS Profiler