Client Statistics is very important. Many a time, people relate queries execution plan with query cost. This is not a good comparison. Both are different parameters, and they are not always related. It is possible that the query cost of any statement is less, but the amount of the data returned is considerably large, which is causing any query to run slow. How do we know if any query is retrieving a large amount data or very little data? In one way, it is quite easy to figure this out by just looking at the result set; however, this method cannot be relied upon all the time as it is difficult to reach a conclusion when there are many columns and many rows.
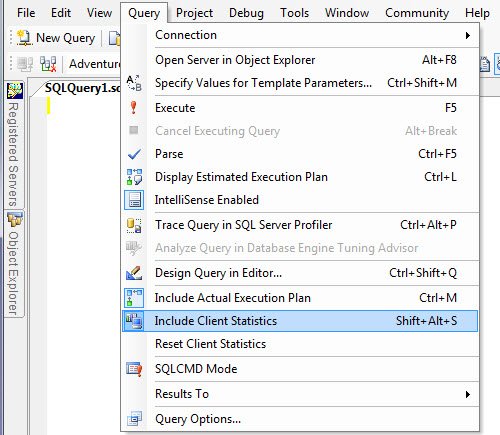
To measure how much data is retrieved from server to client side is very simple. SQL Server Management Studio has feature that can measure client statistics. There are three different ways to enable client statistics.
Method 1
Press SHIFT+ALT+S together.
Method 2
Go to Menu >> Query >> Include Client Statistics

Method 3

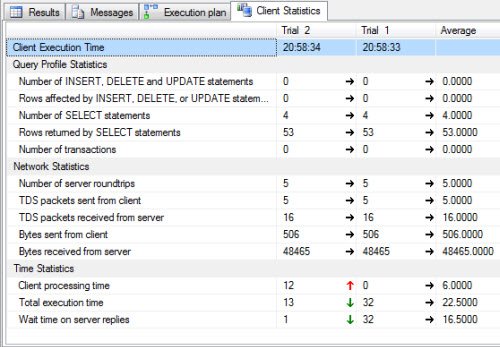
Once you enable the client statistics, it will display another tab in the result span; when clicked, we obtain the following:

As shown in the image, it will capture details for different trials and they are compared with each other. Green arrows indicate improved statistics and red arrows indicate degrading statistics. Please note that here an increase does not always imply a good result; sometimes some statistics when marked as “up” can imply a bad result as well. For the same reason, they are colored in green and red, signifying good and bad results, respectively.
A maximum of 10 trials are averaged in the display window. When the11th trial comes into the result, the very first trial is dropped, keeping total average of latest 10 trials. There are many other aspects about client statistics; these shall be discussed in other articles.
Do you use this particular feature of SQL Server? If you do, what do you use it for?
Reference: Pinal Dave (https://blog.sqlauthority.com)


15 Comments. Leave new
Wow. So many thing i never bothered looking at. This may prove to be nice when testing different approaches to the same query.
Great thnx for this article.
I will thankful if you can evaluate our SQL Server Performance and Tuning tool SQL Shot.
Really nice features and very useful when we do development of procedures.
Also useful in Analysis of Cursors.
Dave, As one reader has pointed out there are many switches and features in SQL Server.
I’ve used this feature to compare queries that do the same thing but have different approaches. For example, I had a query that selected a MAX value and a list if items (GROUP BY) approach. The alternate query used a row_number() using the partition and ORDERing on the MAX value descending.
In this case I determined that even though the MAX/GROUP BY approach ran a bit slower, consistently, than the ROW_NUMBER approach, I opted with the GROUP BY in the production code simply because of it’s simplicitiy. In other words I was still willing to trade off a slight performance advantage for ease of support for future generations (those that have to read my stuff down the road).
Another point to add, which I know you have somewhere in your blogsite, is to make sure to flush the data and query cache between queries, unless the goal is to determine the cost of parsing, algebrizing and creating a plan.
Finally, it’s worth noting the difference between client statistic; index statistics and data statistics/sampling/histograms.
Awesome job on this site!
Dave
Hi,
Really good feature, would be very useful when testing out queries and testing performance when large amounts of data retrieved.
thank you this is very clear explonation and essay
Hello
I dont know if is the right approach, but i used it to check the size in kb of the resultset. I get the bytes sent by the server and divided by 1024. It was the first time i used it.
Hi…
What is the unit of time returned for “Total Time Execution” ?
thanks
yenkay
Client processing time
The cumulative amount of time that the client spent executing code while the query was executed.
Total execution time
The cumulative amount of time (in milliseconds) that the client spent processing while the query was executed, including the time that the client spent waiting for replies from the server as well as the time spent executing code.
Wait time on server replies
The cumulative amount of time (in milliseconds) that the client spent while it waited for the server to reply.
Dear Pinal.
Is there any way to reset -clean- the results of the client statistics pane?
Thanks for your answer
Albert
Query Menu -> Reset Client Statistics
It would be nice to have a button or context sensitive menu option for this but I can’t find one.
Is it possible to get client statistics from any client (not just management studio)?
What are the units for processing and execution time in the statistics? ms or microseconds or some thing else? further can we get any information on the use of the memory?
looks like ms.