
You can read query percentage complete for a running query from the rows each operator has produced. No view has a column with that name. The view sys.dm_exec_query_profiles holds the counters, and a short query turns them into percentages.

What the View Offers
Each operator in the plan of a running query has a row in the view. It holds the rows produced so far and the rows the plan expected. Divide the first by the second and you have the query percentage complete for that operator. The view fills only when query profiling is on for the running statement. From SQL Server 2019 on, lightweight profiling is on by default. SQL Server 2016 SP1 and 2017 need trace flag 7412, and older versions have no lightweight profiling. Check the database setting first.
SELECT name, value, is_value_default
FROM sys.database_scoped_configurations
WHERE name = N'LIGHTWEIGHT_QUERY_PROFILING';
The value is 1 and it is the default. If a monitor query comes back empty on your server, this setting is the first thing to read. To switch it on, run ALTER DATABASE SCOPED CONFIGURATION SET LIGHTWEIGHT_QUERY_PROFILING = ON; in that database. Reading the view for other sessions needs the VIEW SERVER STATE permission. On SQL Server 2022 and later, VIEW SERVER PERFORMANCE STATE is enough.
A Long Query to Watch
The demo database is PercentCompleteDemo. Its Lines table holds 1,000,000 rows in 1,000 groups of 1,000. The script can run twice.
IF DB_ID(N'PercentCompleteDemo') IS NULL CREATE DATABASE PercentCompleteDemo;
GO
USE PercentCompleteDemo;
GO
DROP TABLE IF EXISTS dbo.Lines;
CREATE TABLE dbo.Lines (
    LineID  int NOT NULL CONSTRAINT PK_Lines PRIMARY KEY,
    GroupID int NOT NULL,
    Amount  decimal(10,2) NOT NULL
);
INSERT INTO dbo.Lines (LineID, GroupID, Amount)
SELECT n, n % 1000, n % 500
FROM (SELECT TOP (1000000) ROW_NUMBER() OVER (ORDER BY (SELECT NULL)) AS n
      FROM sys.all_objects AS a CROSS JOIN sys.all_objects AS b CROSS JOIN sys.all_objects AS c) AS x;
The demo needs two query windows. In window 1, start a statement that takes a while. It counts every pair of lines in the same group, which is 499,500,000 pairs. It runs for twenty to thirty seconds, depending on the server.
USE PercentCompleteDemo;
SELECT COUNT_BIG(*) AS Pairs
FROM dbo.Lines AS a
INNER JOIN dbo.Lines AS b ON a.GroupID = b.GroupID AND a.LineID < b.LineID
OPTION (MAXDOP 1);
Read the Progress
While window 1 runs, start window 2. The first query finds the running request in this database and leaves out system tasks. Your session number differs.
USE PercentCompleteDemo;
SELECT r.session_id, DATEDIFF(SECOND, r.start_time, SYSDATETIME()) AS ElapsedSec,
       r.status, r.command, r.wait_type, r.cpu_time AS CpuMs
FROM sys.dm_exec_requests AS r
WHERE r.database_id = DB_ID(N'PercentCompleteDemo') AND r.session_id <> @@SPID
AND r.status <> N'background';| session_id | ElapsedSec | status | command | wait_type | CpuMs |
|---|---|---|---|---|---|
| 54 | 9 | running | SELECT | NULL | 9106 |
The status is running, and the CPU time is close to the elapsed time. The query is working, not waiting.
The second query reads the counters. It sums both columns for each operator, which gives the right figure for serial and parallel plans. The query groups by session and request, so each running statement gets its own rows. Operators that have produced no rows yet are left out.
SELECT p.session_id, p.request_id, p.node_id, p.physical_operator_name,
       SUM(p.row_count) AS RowsSoFar,
       SUM(p.estimate_row_count) AS RowsExpected,
       CONVERT(decimal(12,1), 100.0 * SUM(p.row_count) / NULLIF(SUM(p.estimate_row_count), 0)) AS PercentOfEstimate
FROM sys.dm_exec_requests AS r
JOIN sys.dm_exec_query_profiles AS p ON p.session_id = r.session_id AND p.request_id = r.request_id
WHERE r.database_id = DB_ID(N'PercentCompleteDemo') AND r.session_id <> @@SPID
GROUP BY p.session_id, p.request_id, p.node_id, p.physical_operator_name
HAVING SUM(p.row_count) > 0
ORDER BY p.session_id, p.node_id;
This reading came about nine seconds into the statement. Yours will differ.
| session_id | request_id | node_id | physical_operator_name | RowsSoFar | RowsExpected | PercentOfEstimate |
|---|---|---|---|---|---|---|
| 54 | 0 | 1 | Adaptive Join | 60455576 | 1000000 | 6045.6 |
| 54 | 0 | 2 | Hash Match | 60455576 | 1000000 | 6045.6 |
| 54 | 0 | 3 | Clustered Index Scan | 1000000 | 1000000 | 100.0 |
| 54 | 0 | 4 | Clustered Index Scan | 348300 | 1000000 | 34.8 |
Why a Percentage Passes 100
A percentage of 400 or more surprises people, and the table above shows it. The join and the hash match show 6,045.6 percent. They have produced 60 million rows against an estimate of one million. The scan of the build side sits at exactly 100 percent. The scan of the probe side is partway through its table.
The estimate is what the optimizer expected before the query ran. The row count is what happened. When the join produces far more rows than predicted, the percentage runs past 100. That is not a bug in the query. It tells you the estimate was wrong, and a wrong estimate is the finding.
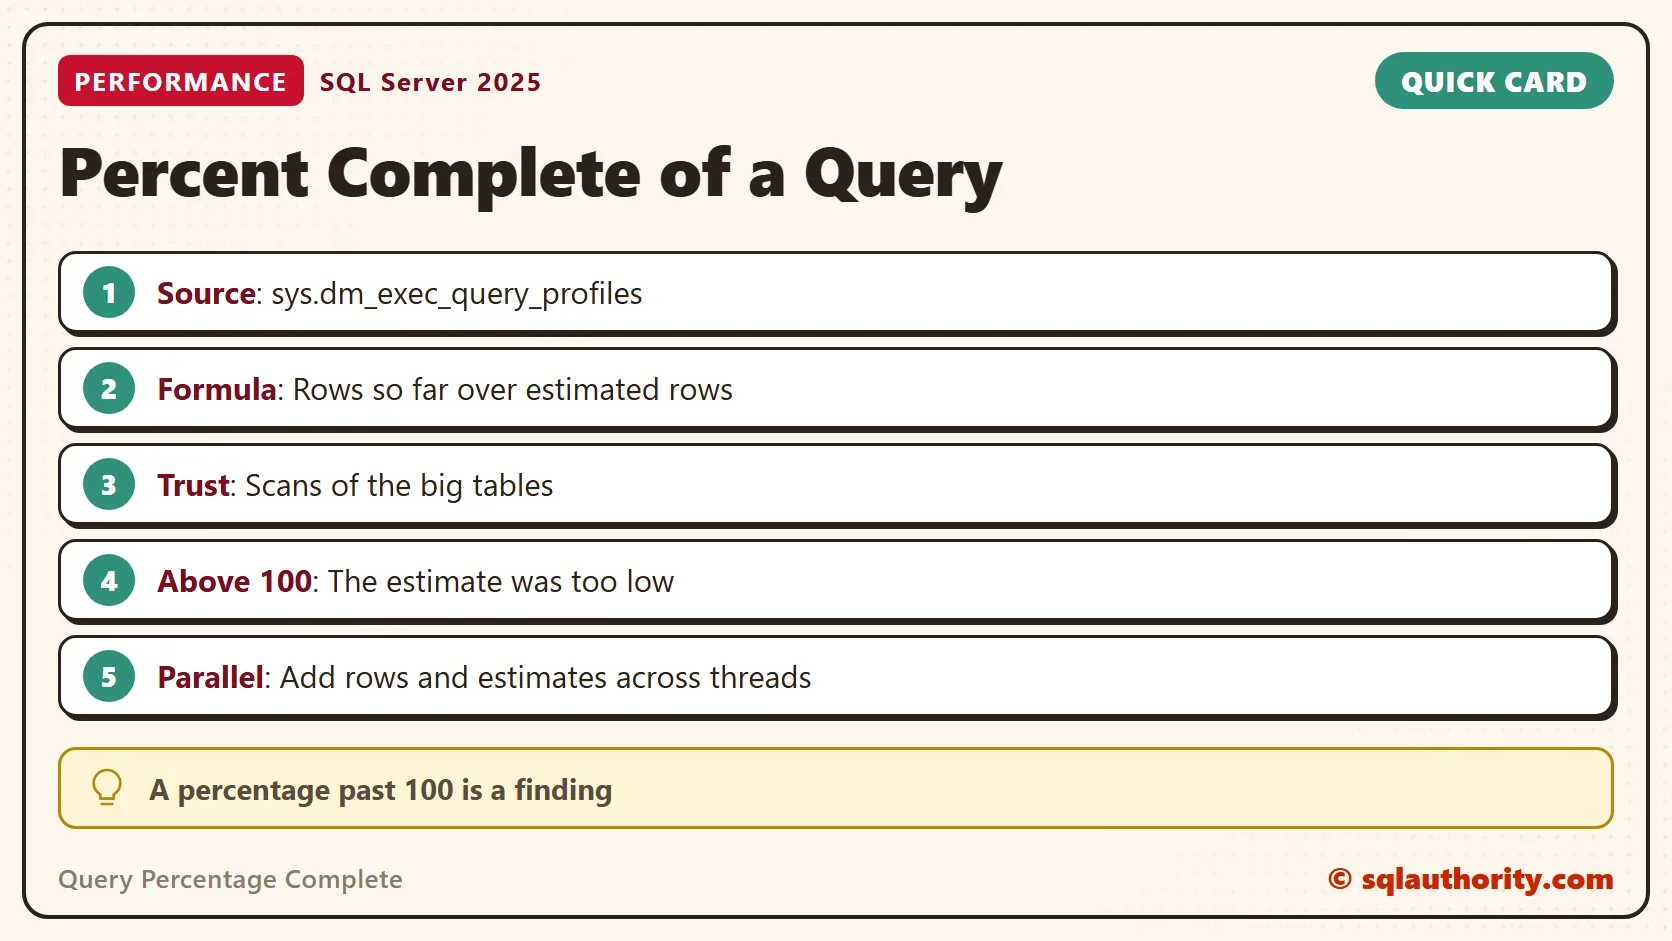
For an overall figure, use the scans. A scan without a filter reads a known number of rows, so its percentage is a fair measure of progress. That holds outside the inner side of a nested loops join and under no TOP. The query below keeps only the scans and caps each at 100. This is the query percentage complete that you can trust.
SELECT p.session_id, p.request_id, p.node_id, p.physical_operator_name,
       CONVERT(decimal(5,1), CASE WHEN 100.0 * SUM(p.row_count) / NULLIF(SUM(p.estimate_row_count), 0) > 100
                                  THEN 100.0
                                  ELSE 100.0 * SUM(p.row_count) / NULLIF(SUM(p.estimate_row_count), 0) END) AS CappedPercent
FROM sys.dm_exec_requests AS r
JOIN sys.dm_exec_query_profiles AS p ON p.session_id = r.session_id AND p.request_id = r.request_id
WHERE r.database_id = DB_ID(N'PercentCompleteDemo') AND r.session_id <> @@SPID
  AND p.physical_operator_name LIKE N'%Scan%'
GROUP BY p.session_id, p.request_id, p.node_id, p.physical_operator_name
ORDER BY p.session_id, p.node_id;| session_id | request_id | node_id | physical_operator_name | CappedPercent |
|---|---|---|---|---|
| 54 | 0 | 3 | Clustered Index Scan | 100.0 |
| 54 | 0 | 4 | Clustered Index Scan | 34.9 |
The probe side scan is the one that moves. A moment after the earlier reading, it stood at 34.9 percent. The whole statement takes twenty to thirty seconds, and the scan reaches 100 percent only at the end.
Parallel Plans
In a parallel plan, each thread reports its own share of the estimate. With MAXDOP 4, each of four threads showed 150,000 expected rows on a 1,000,000 row scan. Summing both columns per operator, as the queries above do, gives the full estimate and the full count. Averaging the rows of single threads would not.
The Argument Against
You could argue that a query percentage complete built on estimates is not honest. It is honest about what it is: progress against the plan. When the plan is right, the figure is right, and when the plan is wrong the overshoot says so. That is more than any other number gives you while the query is still running.
SSMS can draw the same counters on the plan with Include Live Query Statistics. The queries above give you the numbers in text, which suits a script, a log or a remote session.
What to Remember
Read the scans for the query percentage complete and the operators above them for estimate errors. Check LIGHTWEIGHT_QUERY_PROFILING when the view is empty. When you finish testing, drop the example database.
USE master;
GO
ALTER DATABASE PercentCompleteDemo SET SINGLE_USER WITH ROLLBACK IMMEDIATE;
DROP DATABASE PercentCompleteDemo;
A long query is not a black box, it is a plan that keeps counting.
Published by Pinal Dave on SQLAuthority. More of my work at pinaldave.com.
Discover more from SQL Authority with Pinal Dave
Subscribe to get the latest posts sent to your email.




1 Comment. Leave new
The percentComplete column is showing 400%. What to do in that case?