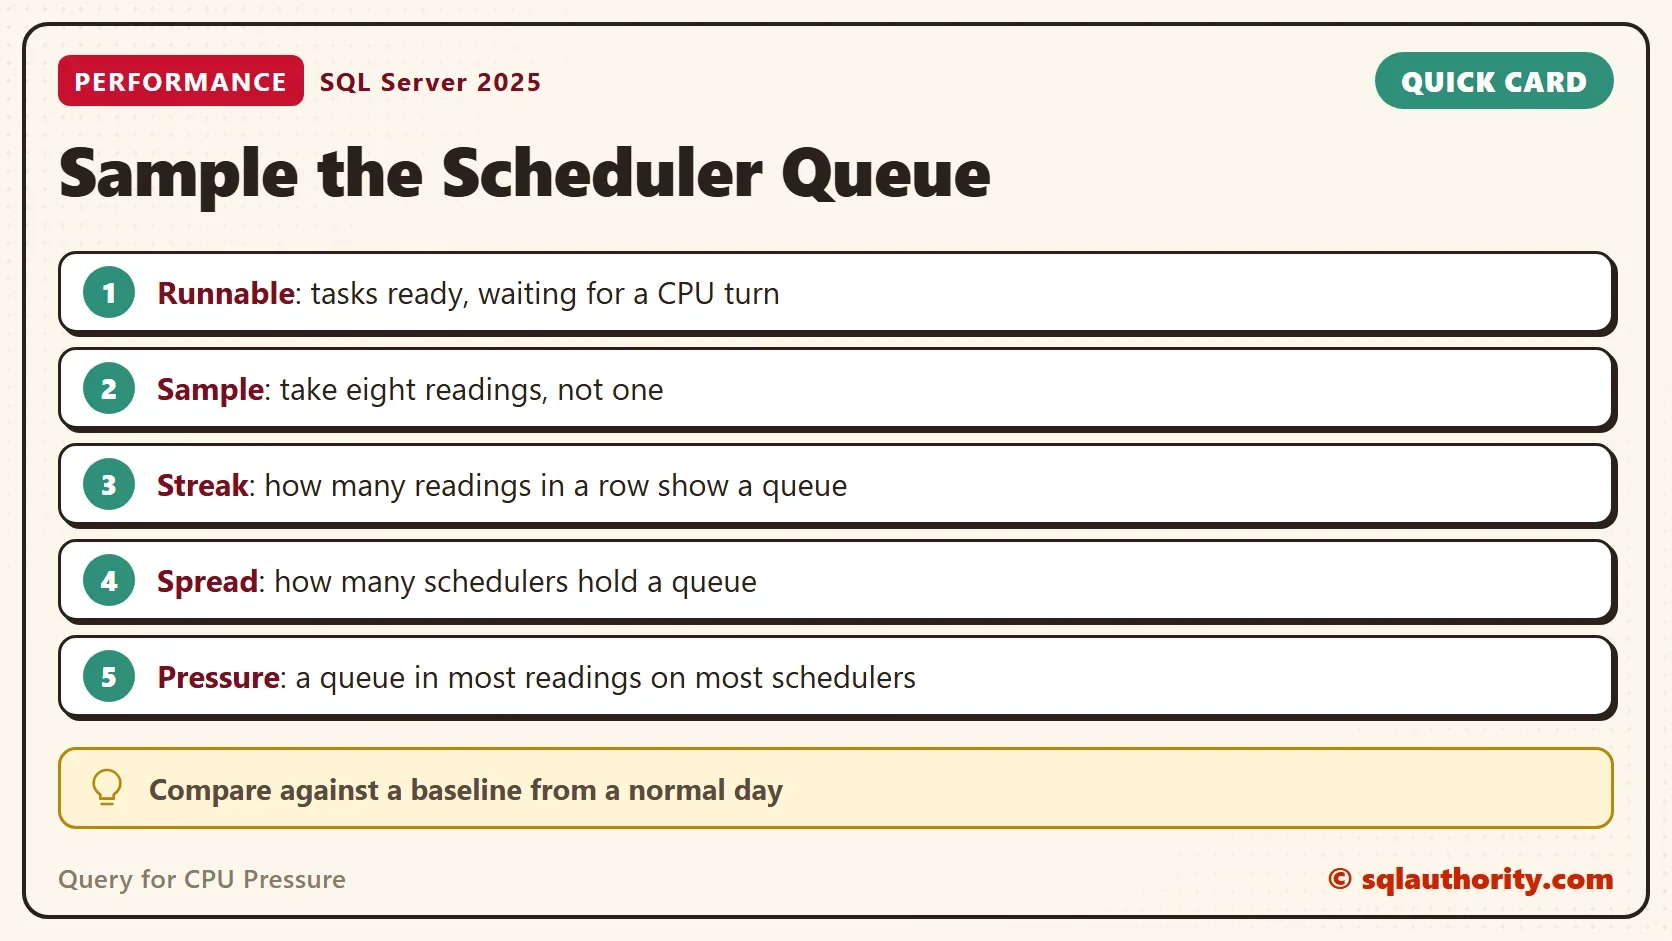
To sample the scheduler queue, read the runnable counts several times and compare them with a baseline. One reading is only a snapshot. A short sampler turns the counts into a trend, and a load test then shows what pressure looks like.

What the Queue Is
SQL Server creates one scheduler for each logical processor it uses. A scheduler runs one task at a time. A task that is ready but finds every scheduler busy waits in a queue. The column runnable_tasks_count counts those tasks, so a queue that keeps growing is the clearest sign of CPU pressure.
The view has other counters, such as work_queue_count and pending_disk_io_count, and each one points somewhere else. For what they mean, read Measure CPU Pressure in SQL Server with Waits and Schedulers. It also gives the wait-based view of the same problem. The sampler below keeps only the runnable counts.
Sample the Scheduler Queue Instead of Reading It Once
A single reading can land on a lucky moment. To sample the scheduler queue, the loop below takes eight readings, one second apart. It keeps one row for every scheduler in every reading, so the result can show how the queue spreads. The filter on the status VISIBLE ONLINE leaves out the hidden schedulers that SQL Server uses for itself. The loop ends after eight passes.
SET NOCOUNT ON;
DROP TABLE IF EXISTS #Queue;
CREATE TABLE #Queue (
    SampleNo int NOT NULL,
    SchedulerID int NOT NULL,
    Waiting int NOT NULL,
    PRIMARY KEY (SampleNo, SchedulerID)
);
DECLARE @n int = 1;
WHILE @n <= 8
BEGIN
    INSERT INTO #Queue (SampleNo, SchedulerID, Waiting)
    SELECT @n, scheduler_id, runnable_tasks_count
    FROM sys.dm_os_schedulers
    WHERE status = N'VISIBLE ONLINE';
    IF @n < 8 WAITFOR DELAY '00:00:01';
    SET @n += 1;
END;
SELECT TOP (5) SchedulerID,
       SUM(CASE WHEN Waiting > 0 THEN 1 ELSE 0 END) AS QueuedSamples,
       MAX(Waiting) AS PeakWaiting
FROM #Queue
GROUP BY SchedulerID
ORDER BY QueuedSamples DESC, SchedulerID;
WITH BySample AS (
    SELECT SampleNo, SUM(Waiting) AS Waiting
    FROM #Queue
    GROUP BY SampleNo
),
Streaks AS (
    SELECT SampleNo - ROW_NUMBER() OVER (ORDER BY SampleNo) AS Island
    FROM BySample
    WHERE Waiting > 0
)
SELECT (SELECT COUNT(*) FROM BySample WHERE Waiting > 0) AS SamplesWithQueue,
       ISNULL((SELECT MAX(Len) FROM (SELECT COUNT(*) AS Len FROM Streaks GROUP BY Island) AS s), 0) AS LongestStreak,
       (SELECT COUNT(*) FROM (SELECT SchedulerID FROM #Queue GROUP BY SchedulerID
                              HAVING SUM(CASE WHEN Waiting > 0 THEN 1 ELSE 0 END) > 4) AS q) AS SchedulersQueuedMostly,
       (SELECT COUNT(DISTINCT SchedulerID) FROM #Queue) AS Schedulers,
       CAST((SELECT AVG(1.0 * Waiting) FROM BySample) AS decimal(6,1)) AS AvgWaiting;
Two queries summarize the readings. The first lists the five schedulers that held a queue in the most readings. The second gives the figures for the verdict. SamplesWithQueue counts the readings in which any task waited. LongestStreak is the longest run of such readings in a row.
SchedulersQueuedMostly counts the schedulers that held a queue in more than half of the readings. AvgWaiting is the average number of waiting tasks across all readings. The first number tells whether the queue is steady. The next tells whether it is spread out. The last tells how large it is.
| SchedulerID | QueuedSamples | PeakWaiting |
|---|---|---|
| 2 | 1 | 1 |
| 15 | 1 | 1 |
| 0 | 0 | 0 |
| 1 | 0 | 0 |
| 3 | 0 | 0 |
| SamplesWithQueue | LongestStreak | SchedulersQueuedMostly | Schedulers | AvgWaiting |
|---|---|---|---|---|
| 2 | 1 | 0 | 16 | 0.3 |
The view needs the VIEW SERVER STATE permission, or VIEW SERVER PERFORMANCE STATE on SQL Server 2022 and later. This reading comes from a shared development server with 16 schedulers, so it isn’t silent. Two readings show a single waiting task, never in a row. On a quiet server the baseline is near zero. Record your own, because the baseline from a normal day is the number to compare against.
Create Pressure on Purpose
To see the counts move, give the server more busy sessions than schedulers. The PowerShell script below counts the visible schedulers. It starts that number plus eight copies of sqlcmd, and each one spins on the processor for 30 seconds. Every session ends by itself. Run it only on a test server, and set the server name in the first line. Run the sampler within a few seconds of the start.
$server = '.\SQLDEV'
$schedulers = [int](sqlcmd -S $server -E -C -h -1 -W -Q "SET NOCOUNT ON; SELECT COUNT(*) FROM sys.dm_os_schedulers WHERE status = N'VISIBLE ONLINE'")
$busy = "SET NOCOUNT ON; DECLARE @end datetime2 = DATEADD(SECOND, 30, SYSDATETIME()), @x bigint = 0; WHILE SYSDATETIME() < @end SET @x += 1;"
1..($schedulers + 8) | ForEach-Object {
    Start-Process -FilePath sqlcmd -ArgumentList @('-S', $server, '-E', '-C', '-Q', "`"$busy`"") -NoNewWindow -RedirectStandardOutput NUL
}
This run used 24 busy sessions on 16 schedulers. The sampler started three seconds after the sessions did.
| SchedulerID | QueuedSamples | PeakWaiting |
|---|---|---|
| 0 | 8 | 1 |
| 1 | 8 | 1 |
| 2 | 8 | 2 |
| 4 | 8 | 1 |
| 6 | 8 | 1 |
| SamplesWithQueue | LongestStreak | SchedulersQueuedMostly | Schedulers | AvgWaiting |
|---|---|---|---|---|
| 8 | 8 | 9 | 16 | 10.4 |
The queue shows in every reading, and it never leaves: the streak is 8 of 8. Nine of the 16 schedulers hold a queue in most readings. The average is 10.4 waiting tasks, against 0.3 at baseline. With 24 busy sessions on 16 schedulers, at least 8 tasks must wait. Other work on this shared server adds to the count, so your numbers will differ.
Read the Samples
The verdict rests on three questions. Does the queue show in most readings, or in one? Does it sit on many schedulers, or on one? Is it far above your baseline? When you sample the scheduler queue and the answer to all three is yes, the server has CPU pressure. A short queue in a single reading doesn’t.
When the verdict is pressure, find the work behind it. The wait statistics show how long tasks spend in the queue. A high pending I/O count with a short runnable queue points at storage. Then the next step is a look at disk waits.
When the Queue Isn’t the Whole Story
You could argue that a queue proves little. A busy server can show a queue and still serve users well. That is true for a short queue. The measure that matters to users is how long tasks wait, and the wait statistics report it. Use the queue to decide when to look. Use the waits to decide what to fix.
What to Remember
To sample the scheduler queue is to trade one lucky number for a trend. Record a baseline on a normal day and compare each later run with it. Read the streak, the spread and the average together. The load test leaves nothing behind. The temp table of the sampler disappears with the session.
CPU pressure is not a high number, it is a queue that never empties.
Published by Pinal Dave on SQLAuthority. More of my work at pinaldave.com.
Discover more from SQL Authority with Pinal Dave
Subscribe to get the latest posts sent to your email.