Capture Query Plans with Extended Events when you can’t run the slow query by hand. A scoped session watches one database, ignores fast statements and keeps the plan of each slow one. Let’s build one, read what it catches and see why it must stay short-lived.

Why a Captured Plan Beats a Guess
In SSMS you press Ctrl+M and run the query yourself. That works for a query you can reach. A slow report that runs from an application, with other parameter values on a busy server, is out of reach.
For that case you want the server to write down the actual plan while the slow query runs. SQL Trace and Profiler were the old way to capture query plans. Both are deprecated, so new work belongs in Extended Events. I skip the Profiler steps here.
Extended Events, XE for short, is a built-in feature. You pick an event, such as “a statement finished”, add a filter, and choose a target where the records land.
Build the Test Database
I ran everything here on SQL Server 2025. The script makes a database with 200,000 orders, so a slow query is easy to produce.
IF DB_ID(N'SqlCapturePlanDemo') IS NULL CREATE DATABASE SqlCapturePlanDemo;
GO
USE SqlCapturePlanDemo;
GO
DROP TABLE IF EXISTS dbo.Orders;
CREATE TABLE dbo.Orders
(
    OrderID int IDENTITY(1,1) PRIMARY KEY,
    CustomerID int NOT NULL,
    Amount decimal(10,2) NOT NULL
);
INSERT INTO dbo.Orders (CustomerID, Amount)
SELECT s.value % 2000 + 1, s.value % 500 + 10.50
FROM GENERATE_SERIES(1, 200000) AS s;
GO
Create a Scoped Session
A session has a few parts. The event is query_post_execution_showplan. It fires when a statement finishes and carries the actual plan, with real row counts. The actions add columns to each record, here the database name and the statement text.
The WHERE clause is the scope. It keeps statements from this database only, and only those that ran longer than 200,000 microseconds, which is 200 milliseconds. On a real server I start near one second. The target, a ring buffer, keeps the newest records in 4 MB of memory.
Check the unit before you copy a threshold. In this event the duration is in microseconds. A value of 200 means 200 microseconds, not 200 milliseconds.
CREATE EVENT SESSION SqlCapturePlanDemo ON SERVER
ADD EVENT sqlserver.query_post_execution_showplan
(
    ACTION (sqlserver.database_name, sqlserver.sql_text)
    WHERE sqlserver.database_name = N'SqlCapturePlanDemo'
      AND duration > 200000
)
ADD TARGET package0.ring_buffer (SET max_memory = 4096);
Creating a session does not start it. Start it with a second statement.
ALTER EVENT SESSION SqlCapturePlanDemo ON SERVER STATE = START;
Run Three Queries
The first query is slow on purpose. It joins the orders table to itself, which produces 20 million rows. The second is a quick one-row lookup.
SELECT TOP (3) a.CustomerID, COUNT(*) AS Pairs
FROM dbo.Orders AS a
JOIN dbo.Orders AS b ON b.CustomerID = a.CustomerID AND b.Amount >= a.Amount
GROUP BY a.CustomerID
ORDER BY Pairs DESC, a.CustomerID;

SELECT COUNT(*) AS OneOrder FROM dbo.Orders WHERE OrderID = 5;
The third query is slow too, but it runs in tempdb. The EXEC line sends a count of 30 million numbers to tempdb. The session then sees a slow query from the wrong database.
EXEC tempdb.sys.sp_executesql N'SELECT COUNT(*) AS OtherDb FROM GENERATE_SERIES(1, 30000000);';
Each query tests one part of the filter. The slow join should pass both tests. The lookup should fail the duration test, and the tempdb count should fail the database test.
Read What the Session Caught
The ring buffer holds XML. This query turns each record into a row. Reading does not stop the session.
SELECT
    x.e.value('(@timestamp)[1]', 'datetime2(0)') AS captured_at,
    x.e.value('(action[@name="database_name"]/value)[1]', 'nvarchar(128)') AS database_name,
    x.e.value('(data[@name="duration"]/value)[1]', 'bigint') / 1000 AS duration_ms,
    x.e.value('(data[@name="cpu_time"]/value)[1]', 'bigint') / 1000 AS cpu_ms,
    x.e.value('(action[@name="sql_text"]/value)[1]', 'nvarchar(40)') AS sql_text
FROM (SELECT CAST(t.target_data AS xml) AS buffer
      FROM sys.dm_xe_session_targets AS t
      JOIN sys.dm_xe_sessions AS s ON s.address = t.event_session_address
      WHERE s.name = N'SqlCapturePlanDemo' AND t.target_name = N'ring_buffer') AS r
CROSS APPLY r.buffer.nodes('RingBufferTarget/event') AS x(e);
One row came back. It is the slow join.
| captured_at | database_name | duration_ms | cpu_ms | sql_text |
|---|---|---|---|---|
| 2026-10-05 13:28:04 | SqlCapturePlanDemo | 561 | 561 | SELECT TOP (3) a.CustomerID, COUNT(*) AS |
The lookup was too quick to pass the duration filter. The tempdb query ran about three seconds, but the database filter dropped it. To prove that, I removed the database line and ran the queries again. This time the tempdb query appeared in the buffer.
The same record holds more than the plan. It also carries the memory grant, the degree of parallelism and the estimated cost. Add any of them as a column when you read the buffer.
Read the Captured Plan
The plan sits in the showplan_xml field. This query returns it as one XML value for each captured statement.
SELECT x.e.query('data[@name="showplan_xml"]/value/*') AS captured_plan
FROM (SELECT CAST(t.target_data AS xml) AS buffer
      FROM sys.dm_xe_session_targets AS t
      JOIN sys.dm_xe_sessions AS s ON s.address = t.event_session_address
      WHERE s.name = N'SqlCapturePlanDemo' AND t.target_name = N'ring_buffer') AS r
CROSS APPLY r.buffer.nodes('RingBufferTarget/event') AS x(e);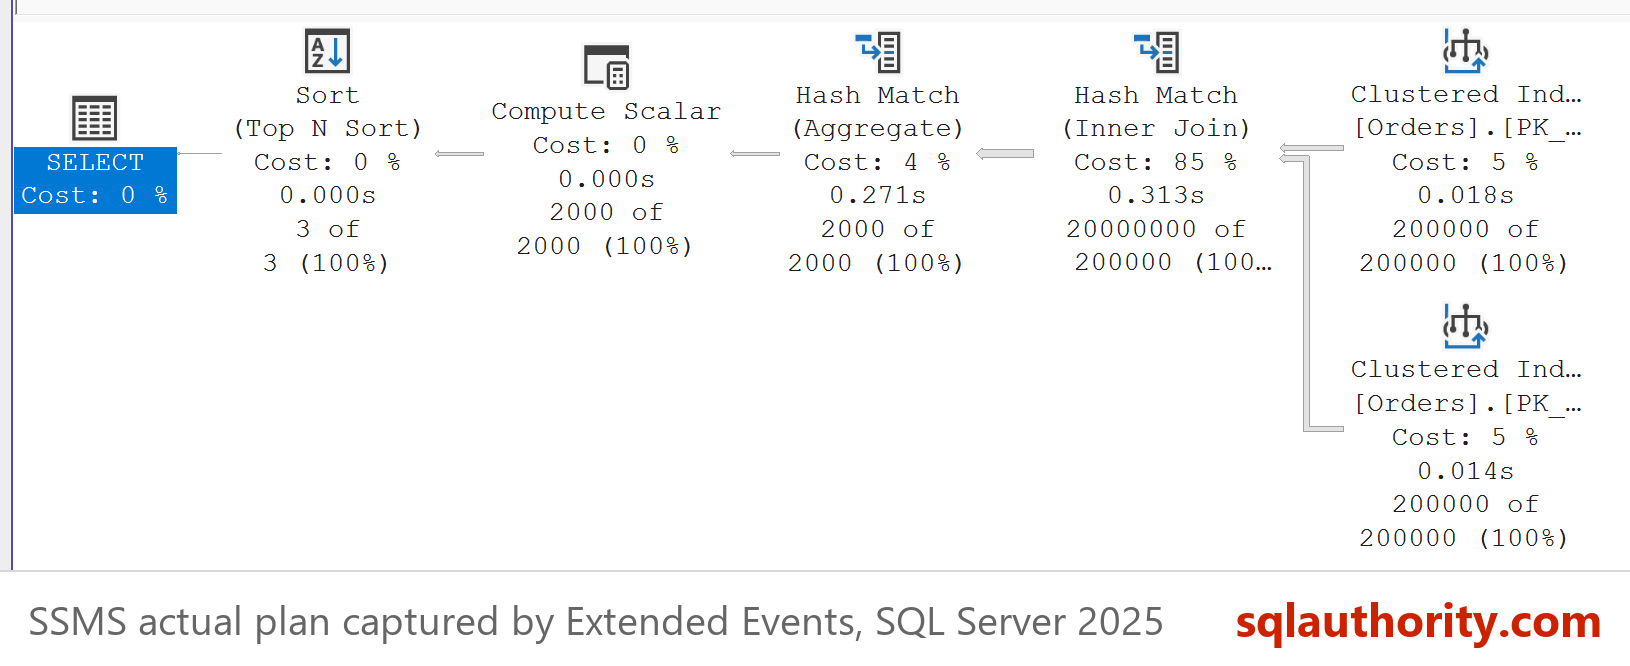
In SSMS, click the XML value in the result grid. The plan opens as a picture. It is an actual plan, so every operator carries actual rows.
| Operator | Estimated rows | Actual rows |
|---|---|---|
| Clustered Index Scan, two of them | 200,000 each | 200,000 each |
| Hash Match (Inner Join) | 200,000 | 20,000,000 |
| Hash Match (Aggregate) | 2,000 | 2,000 |
| Sort (Top N Sort) | 3 | 3 |
The join estimated 200,000 rows and produced 20 million, a hundred times more. That gap is the first thing to read in a plan. Then look for warning icons on the operators, such as a spill to tempdb. My post on estimated vs actual rows explains how to follow the gap.
Why the Session Must Stay Short
An actual plan is not free. The server counts rows in every operator of every statement, because it learns the duration only at the end. The filter then drops the fast records, but the counting has already happened.
This script measures the price. It runs 20,000 one-row lookups, first with the session stopped and then with it started. None of them is slow, so the session stores nothing.
ALTER EVENT SESSION SqlCapturePlanDemo ON SERVER STATE = STOP;
DECLARE @i int = 0, @n int, @t datetime2 = SYSDATETIME(), @off int, @on int;
WHILE @i < 20000
BEGIN
    SELECT @n = COUNT(*) FROM dbo.Orders WHERE OrderID = @i + 1;
    SET @i += 1;
END;
SET @off = DATEDIFF(MILLISECOND, @t, SYSDATETIME());
ALTER EVENT SESSION SqlCapturePlanDemo ON SERVER STATE = START;
SELECT @i = 0, @t = SYSDATETIME();
WHILE @i < 20000
BEGIN
    SELECT @n = COUNT(*) FROM dbo.Orders WHERE OrderID = @i + 1;
    SET @i += 1;
END;
SET @on = DATEDIFF(MILLISECOND, @t, SYSDATETIME());
ALTER EVENT SESSION SqlCapturePlanDemo ON SERVER STATE = STOP;
SELECT @off AS session_off_ms, @on AS session_on_ms;
On this machine the session made the loop about 19 times slower: 159 ms stopped against 3,057 ms started. Repeat runs gave 17 to 27 times. A lighter event, query_post_execution_plan_profile, carries the same runtime counters. It cost about a third less in the same loop, and it is still not free. Neither belongs on a busy server for long.
When the Buffer Fills
A ring buffer is circular. When the 4 MB are full, each new record pushes out the oldest one. One captured plan here is about 11 KB of XML. On a busy server, read the buffer soon after the slow query. For a longer capture, use an event file target, which writes to disk, and delete the file when you finish.
You Could Say Query Store Does This
You could say Query Store already keeps plans, so a session is extra work. Fair point. Query Store is the better first stop for plan history. But it stores compiled plans with averaged runtime numbers, not the actual row counts of one slow run. To capture query plans of one slow run, use a session. Stop it when you have the plan.
A Short Checklist
To capture query plans safely, keep to four habits.
- Scope the session to one database and add a duration threshold.
- Keep the target small: a ring buffer for minutes, an event file for longer captures.
- Start the session, wait for the slow query, read the plan, stop the session.
- Drop the session when the work is done. A stopped session still sits on the server.
If the query ran recently, its plan can still sit in the plan cache. My post on the last known actual execution plan shows that route, with no session at all.
When you finish testing, remove the session and the example database.
USE master;
GO
IF EXISTS (SELECT 1 FROM sys.server_event_sessions WHERE name = N'SqlCapturePlanDemo')
    DROP EVENT SESSION SqlCapturePlanDemo ON SERVER;
GO
ALTER DATABASE SqlCapturePlanDemo SET SINGLE_USER WITH ROLLBACK IMMEDIATE;
DROP DATABASE SqlCapturePlanDemo;
Plan capture is not a monitoring tool, it is a short, scoped experiment.
Published by Pinal Dave on SQLAuthority. More of my work at pinaldave.com.
Discover more from SQL Authority with Pinal Dave
Subscribe to get the latest posts sent to your email.