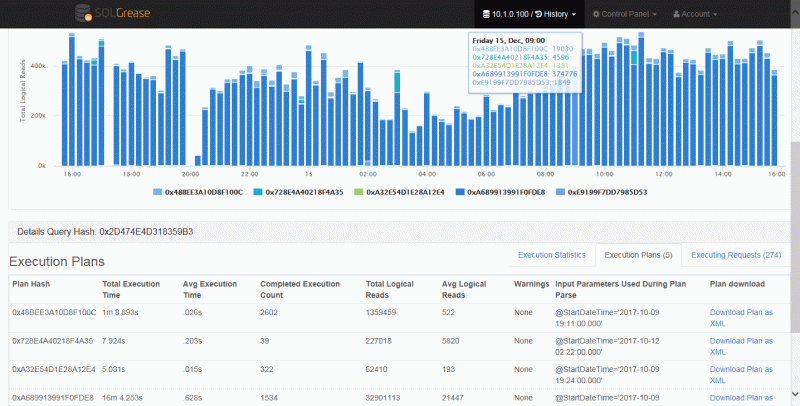
Today’s blog post is the part of the my the Performance Monitoring tools series which I had written earlier. Today, we are going to see another SQL Server Performance Monitoring Tool – SQLGrease in the same spirit as I have evolved others.
My primary aim is to help people with my consulting workshop Comprehensive Database Performance Health Check. While I help customers with their various SQL Server performance issues, I often see them struggling to monitor their SQL Server’s health. One of the primary discussions at the end of the consultation is about which tool is the best for their situation and how it can prevent them from encountering more trouble in the future.
Wait Statistics and Performance
SQL Server wait statistics are my favorite subject and I use this method for looking at performance issues at my customer’s place. I noticed that SQLGrease also uses the same approach for SQL Server Performance Tuning and I was immediately attracted towards it. It can help you to identify the root cause of your complex database issues.
My Top 3 Favorites of SQLGrease
There are many reasons for liking this tool, however, I would love to expand on 3 of the reasons I like it.
Reason 1: Lighting-Fast Root Cause Diagnosis
SQLGrease gets to the root cause of problems within minutes using query level performance analysis. SQLGrease collects various essential information and correlates them together at the query level. This helps it to surface the root cause analysis of the performance problem in relatively very little time. It collects the following different information for its analysis:
- Execution times
- Wait events
- Execution plans
- Execution plan profiles
- IO statistics
- Deadlock analysis
- Tempdb fills
- Session snapshots
Reason 2: Small Footprint at Deployment
The biggest issue, I have with various different performance tuning tools is that the tool itself is extremely expensive in terms of resource to run on the server. In the case of SQLGrease, I was delighted to notice that the agent collector service which collects various data has a small footprint in the network. It is a windows service that collects and sanitizes data from SQL Server instances and a single collector service can collect from multiple SQL Server instances. The collector can run on a server that is configured with as little as 1 GB memory and 1 processor.
Reason 3: Flexible Licensing
In many organizations, it is quite common that users want to measure the performance of various different SQL Server and not just stick to one Server. In most of the cases, the biggest challenge with the performance monitoring tool is that it is not possible to move the licenses from one server/instance to another one.
The licensing of the SQLGrease are floating and it helps DBA/Developers to monitor instances which only required help during certain situations. This is great for SQL Server consultants that need a monitoring platform they can move between clients. Their subscription-based model is indeed a boon to many who wants to temporary monitor their SQL Servers.
When SQLGrease is Best For You?
If your primary responsibility in your organizations is to monitor SQL Server Performance, Security and Deployment, and you are responsible for many SQL Server instances, this tool is the best for you. If your servers are often struggling with available resources and you want low overhead monitoring tool, SQLGrease fits the bill perfectly. It is capable of monitoring your on-premise and cloud deployments.
Call to Action
SQLGrease is fast, efficient, cost-effective and dependable.
I strongly suggest you try out SQLGrease.
Please share your experience with DPA in the comments section.
Reference: Pinal Dave (https://blog.sqlauthority.com)


