Every data team eventually hits the same wall. A number on a dashboard gets questioned, nobody can prove who is right, and trust quietly leaks out of the whole system. Good data quality and observability is what keeps that from happening, and over six posts I worked through how to build it, one hard part at a time.
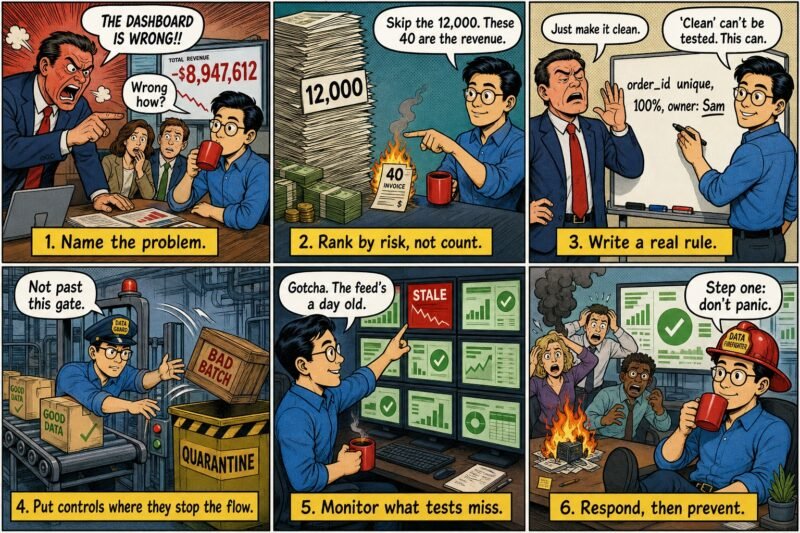
Read on its own, each post solves one problem. Read in order, they follow the path a data team walks as it matures: understand the problem, assess the risk, define the fix, build the controls, monitor for what slips through, and respond calmly when something breaks anyway.
Here is the whole set, with the single idea behind each one and the one thing to do about it.
1. Start by naming the problem
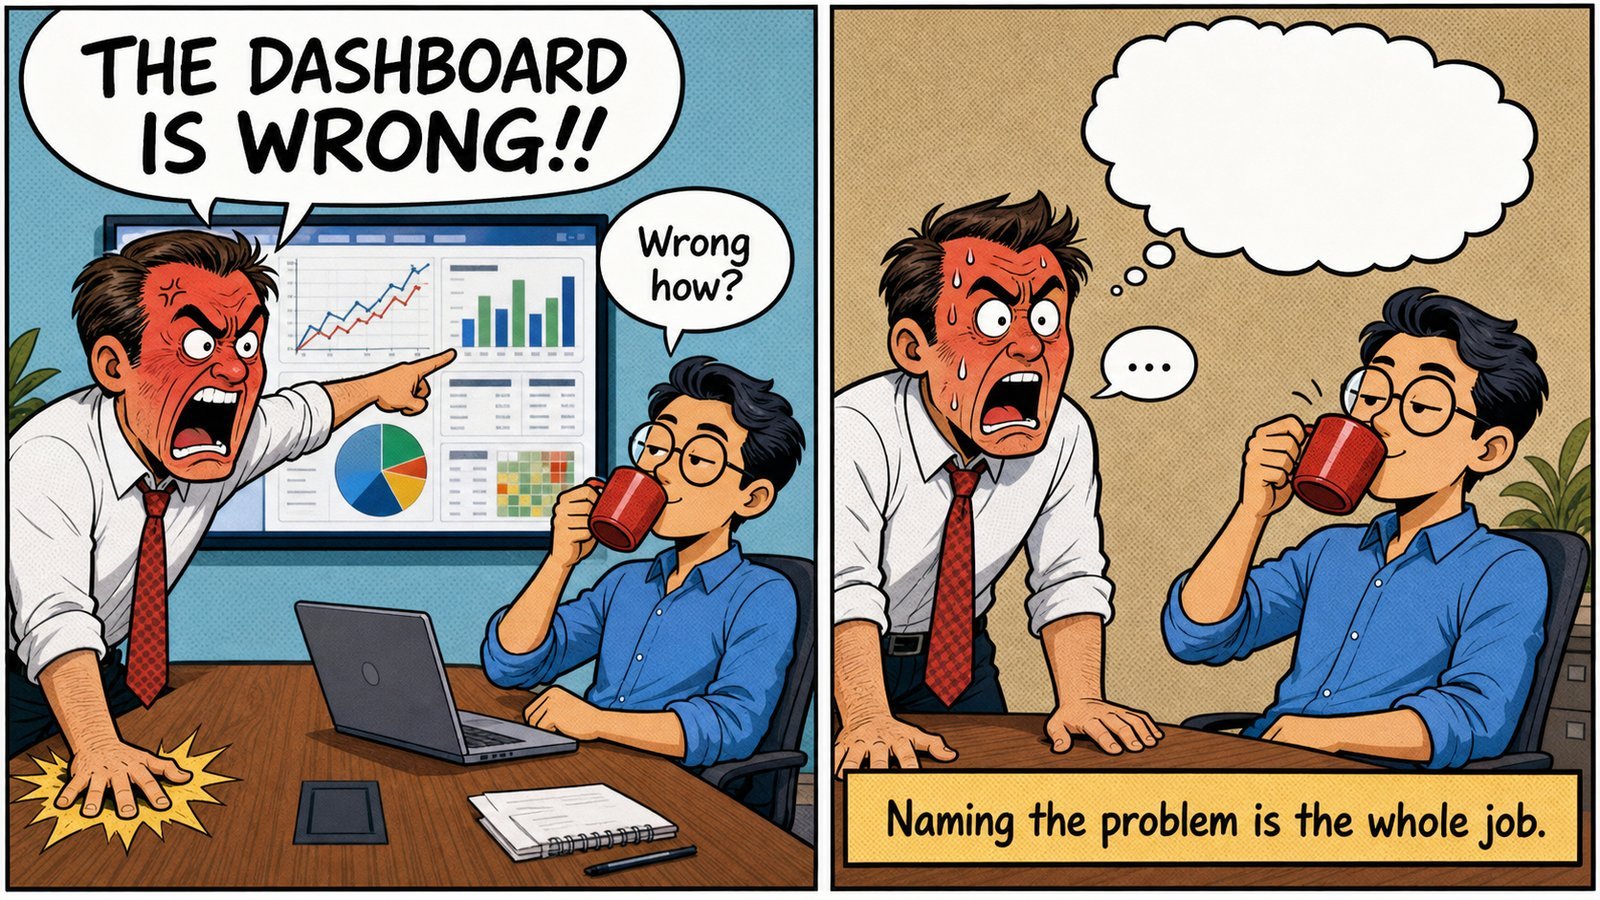
“The dashboard is wrong” is not a diagnosis. It is a feeling, and it hides three different problems: a value that is wrong (quality), a value that is correct but late (reliability), and a change upstream that no rule was watching for (observability). Each one has a different owner and a different fix.
So when a number is disputed, ask three questions before you open a query. Is a value wrong or missing? That is quality. Are the values fine but late? That is reliability. Did something change that no rule saw? That is observability. The label is the fastest way to stop three teams from investigating the same ghost.
The takeaway: name the problem before you touch it, and the fix is already half done.
Read the full post: Data Quality, Data Reliability, and Data Observability: Telling the Three Apart
2. Rank issues by risk, not by row count
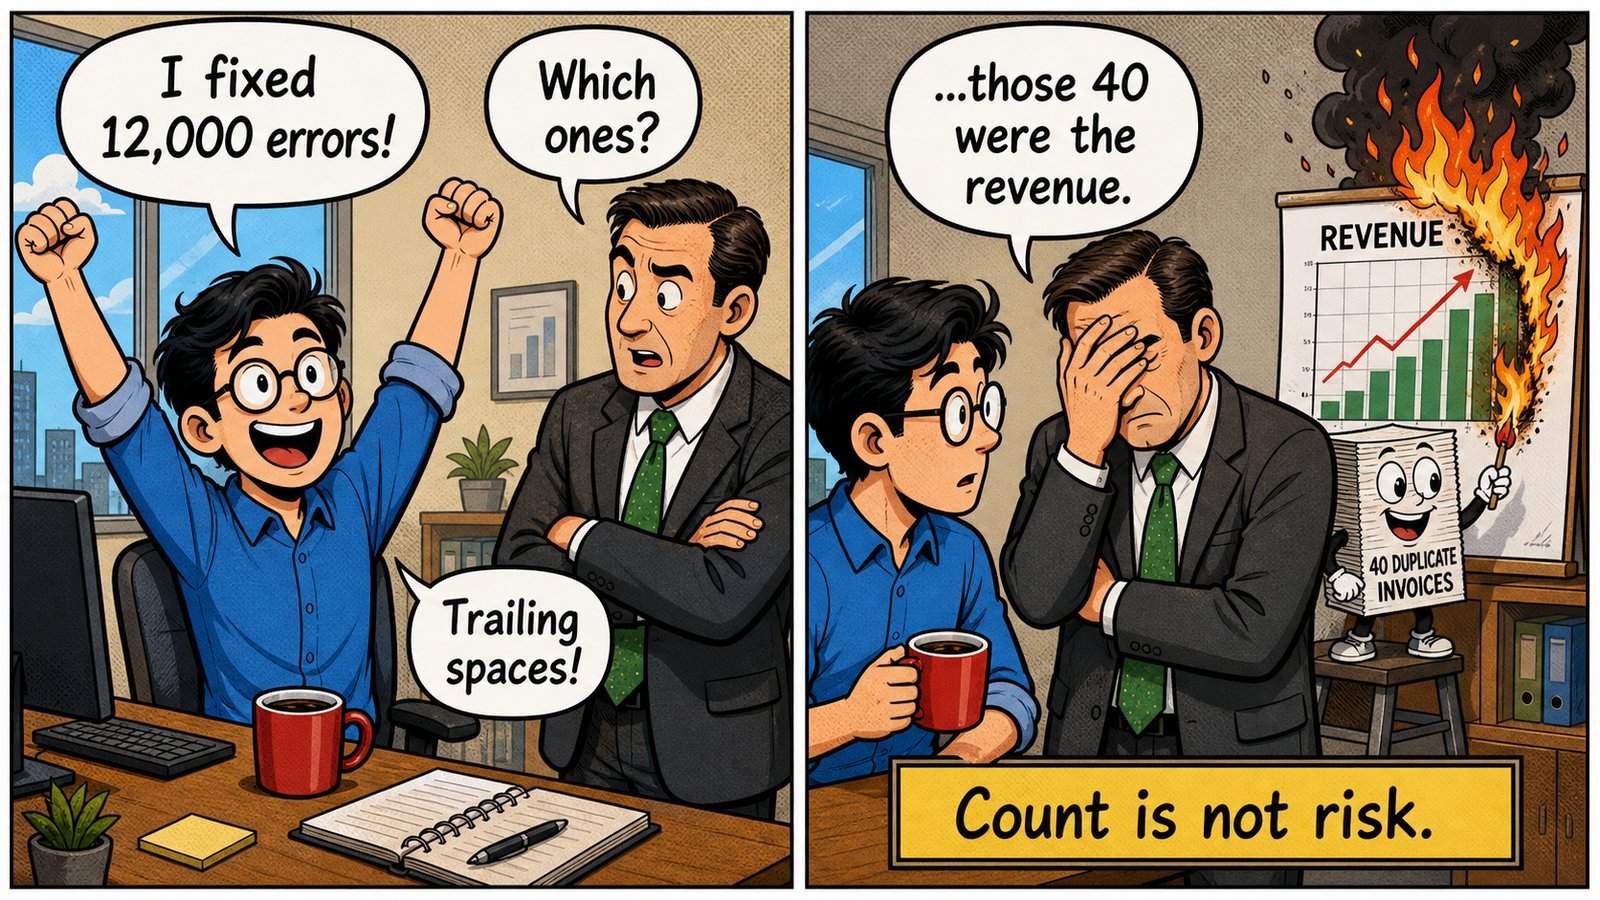
Profile a messy table and the errors with the biggest counts grab all the attention. They are almost never the ones that matter. Forty duplicate invoices feeding the revenue number will hurt you far more than twelve thousand harmless trailing spaces.
The fix is two columns, not a new tool. Next to every finding, write who feels it downstream and how often it happens, then sort by those instead of by count. Impact times likelihood is the whole model, and it quietly floats your real priorities to the top while the loud, harmless piles sink.
The takeaway: the most dangerous issue is rarely the one with the biggest number.
Read the full post: Count Is Not Risk: Ranking Data Issues by What They Actually Cost
3. Turn “clean” into a rule you can test
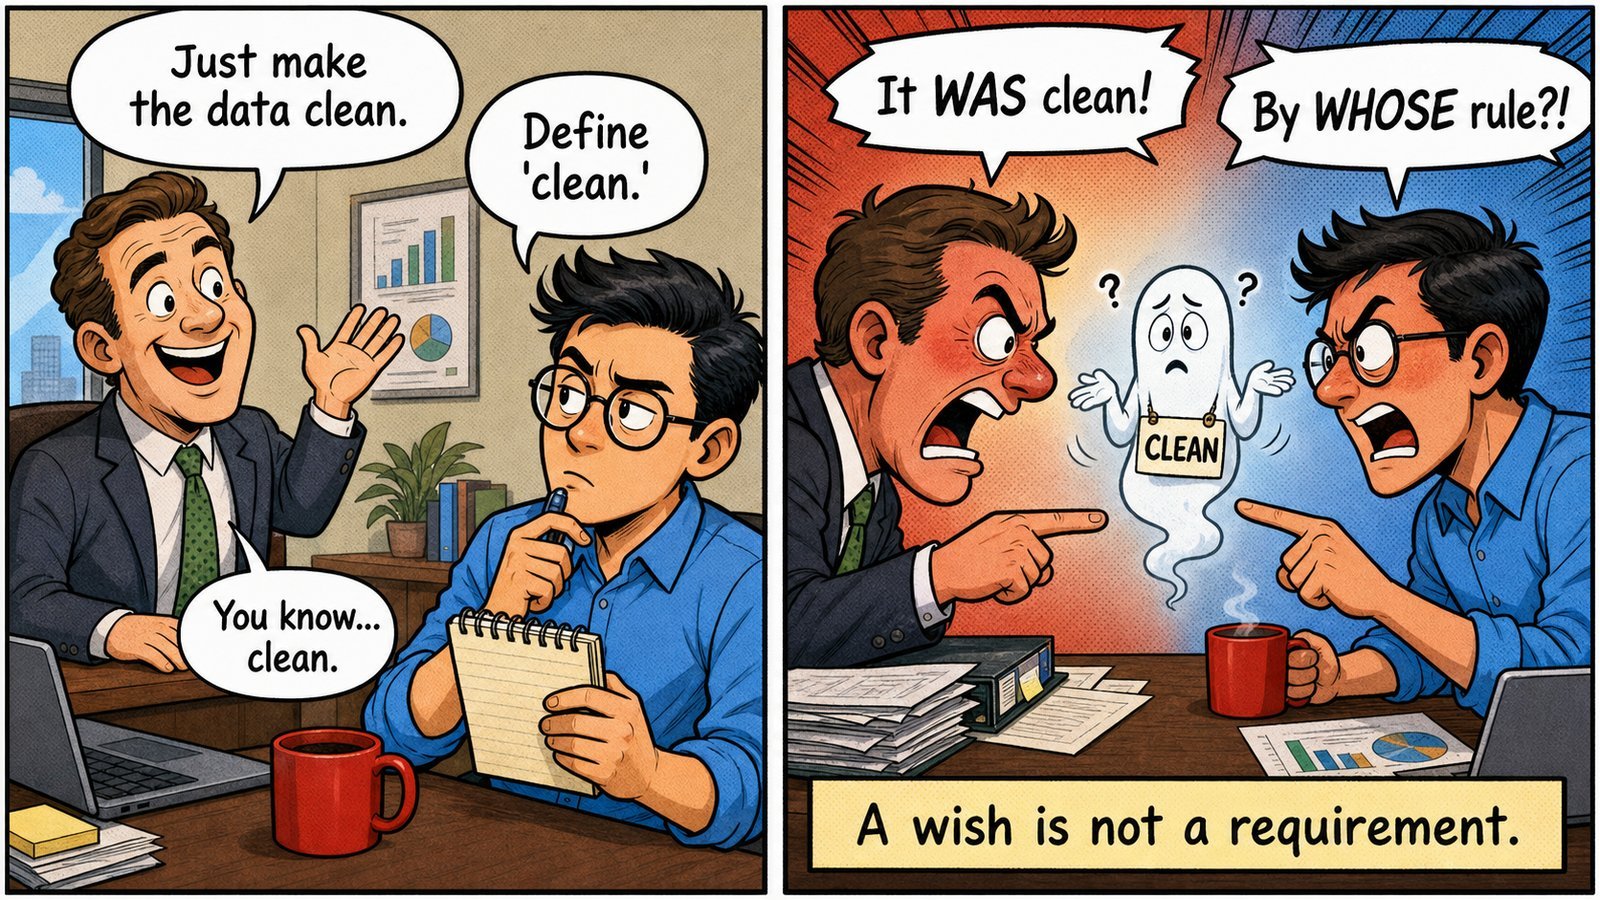
“Just make the data clean” cannot be tested, so it can never be met. A usable requirement has three parts: a rule a check can answer yes or no, a threshold that says how much deviation is acceptable, and a named owner accountable for the definition. That is the difference between a wish and a data contract.
Say each expectation out loud and hold it against three questions. Can I write it as a check that returns a number? Have I decided what number passes? Can I name the person who owns it? Three yeses and you have a requirement. A shrug on any of them and you have a preference.
The takeaway: if it cannot fail a test, it is not a requirement.
Read the full post: “Clean Data” Is Not a Requirement: Writing Rules People Can Act On
4. Put controls where they can actually stop the flow
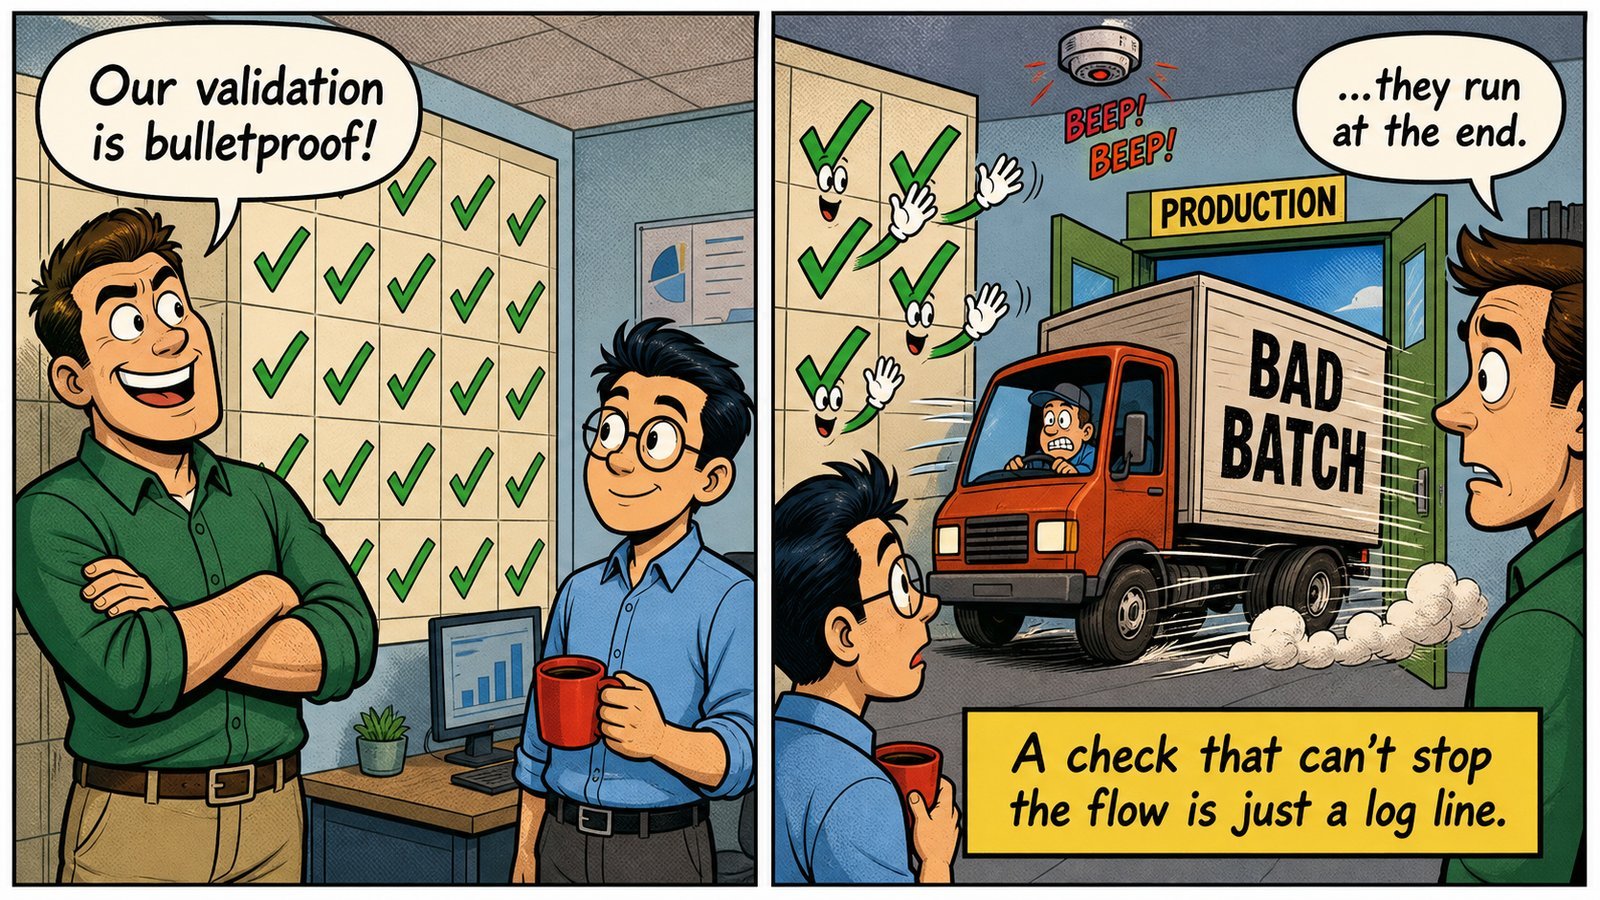
You can have the right check and still catch the problem too late. A validation that runs after publication is a smoke detector wired to go off the morning after the fire.
There are only three places a control can live, and each catches something different. Ingestion stops bad rows at the front door. Transformation catches the errors your own joins and calculations create. The release gate is the last block before anyone downstream reads the data. Put the control at the earliest point that can still stop the problem, decide whether it blocks or only warns, and quarantine what fails so the good data keeps moving.
The takeaway: a check that cannot stop the flow is just a log line.
Read the full post: Where Should a Data Quality Check Live? Gates, Controls, and Quarantine
5. Watch the signals your tests will never catch
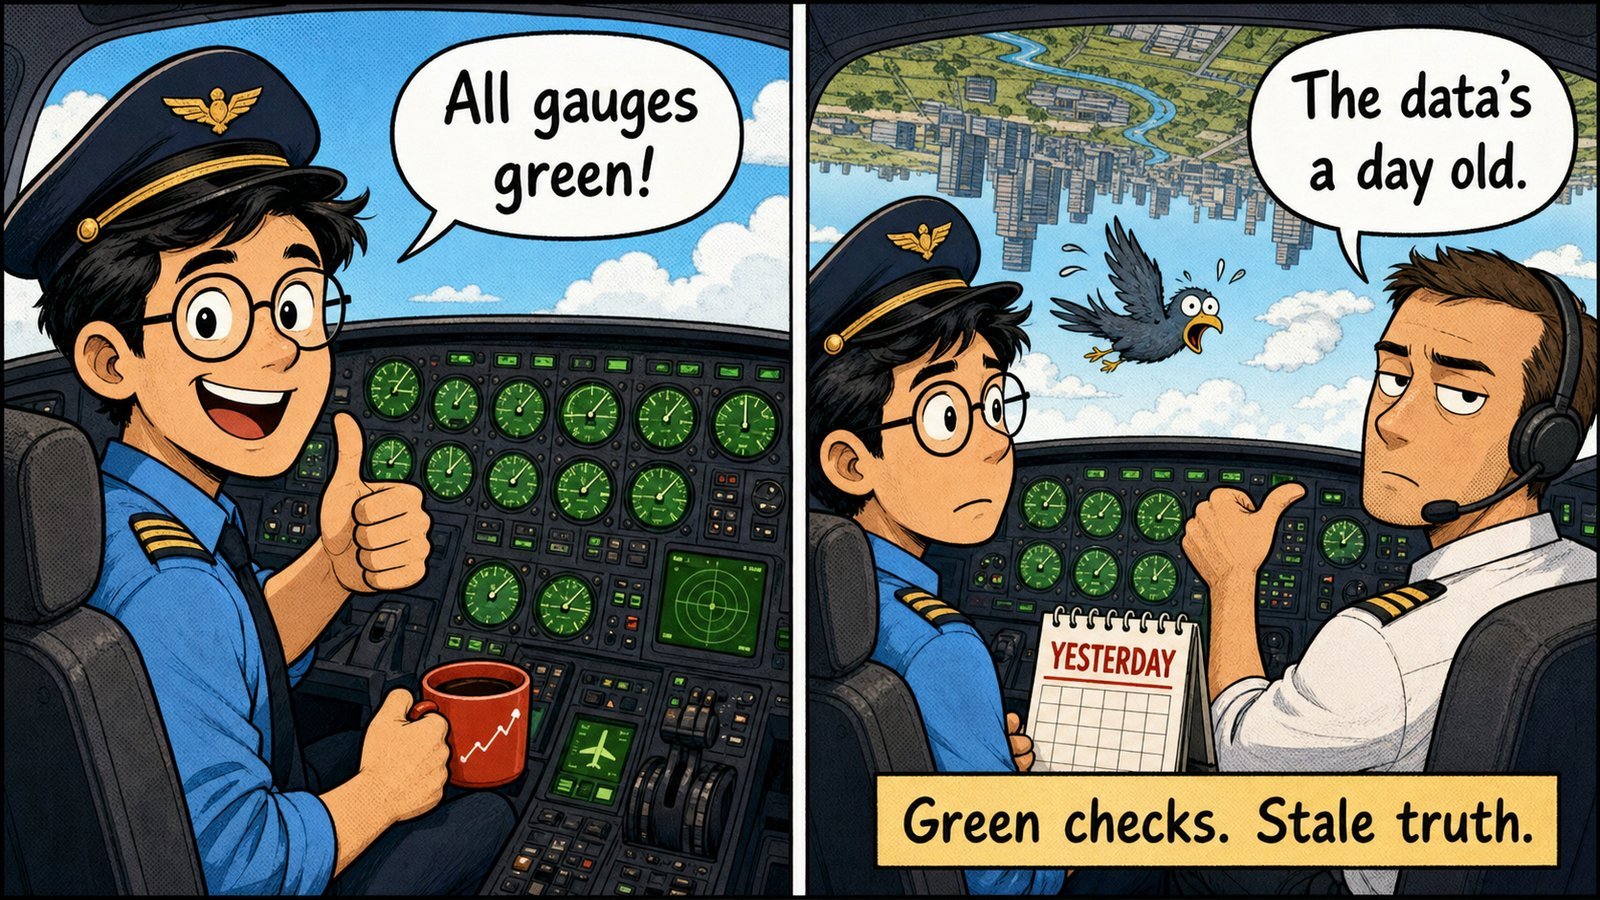
Row-level rules only catch the failures you already imagined. They cannot see a feed that arrived stale, a row count that collapsed, a column that changed type, or a value mix that quietly shifted. Those four signals, freshness, volume, schema, and distribution, are where the surprises live.
You cannot spot abnormal without first defining normal. For your most important table, write down four things: when it should arrive, how many rows is normal, what its schema should be, and the usual mix of values in the column you care about. That is a baseline, and a baseline is most of monitoring. Then alert on the size of the change, not the fact of it, so a two percent wobble stays quiet and a sixty percent drop wakes someone.
The takeaway: rules protect you from the mistakes you imagined, monitoring protects you from the ones you did not.
Read the full post: It Passed Every Test and Still Broke: Four Signals Validation Never Catches
6. Respond to a data incident without panic
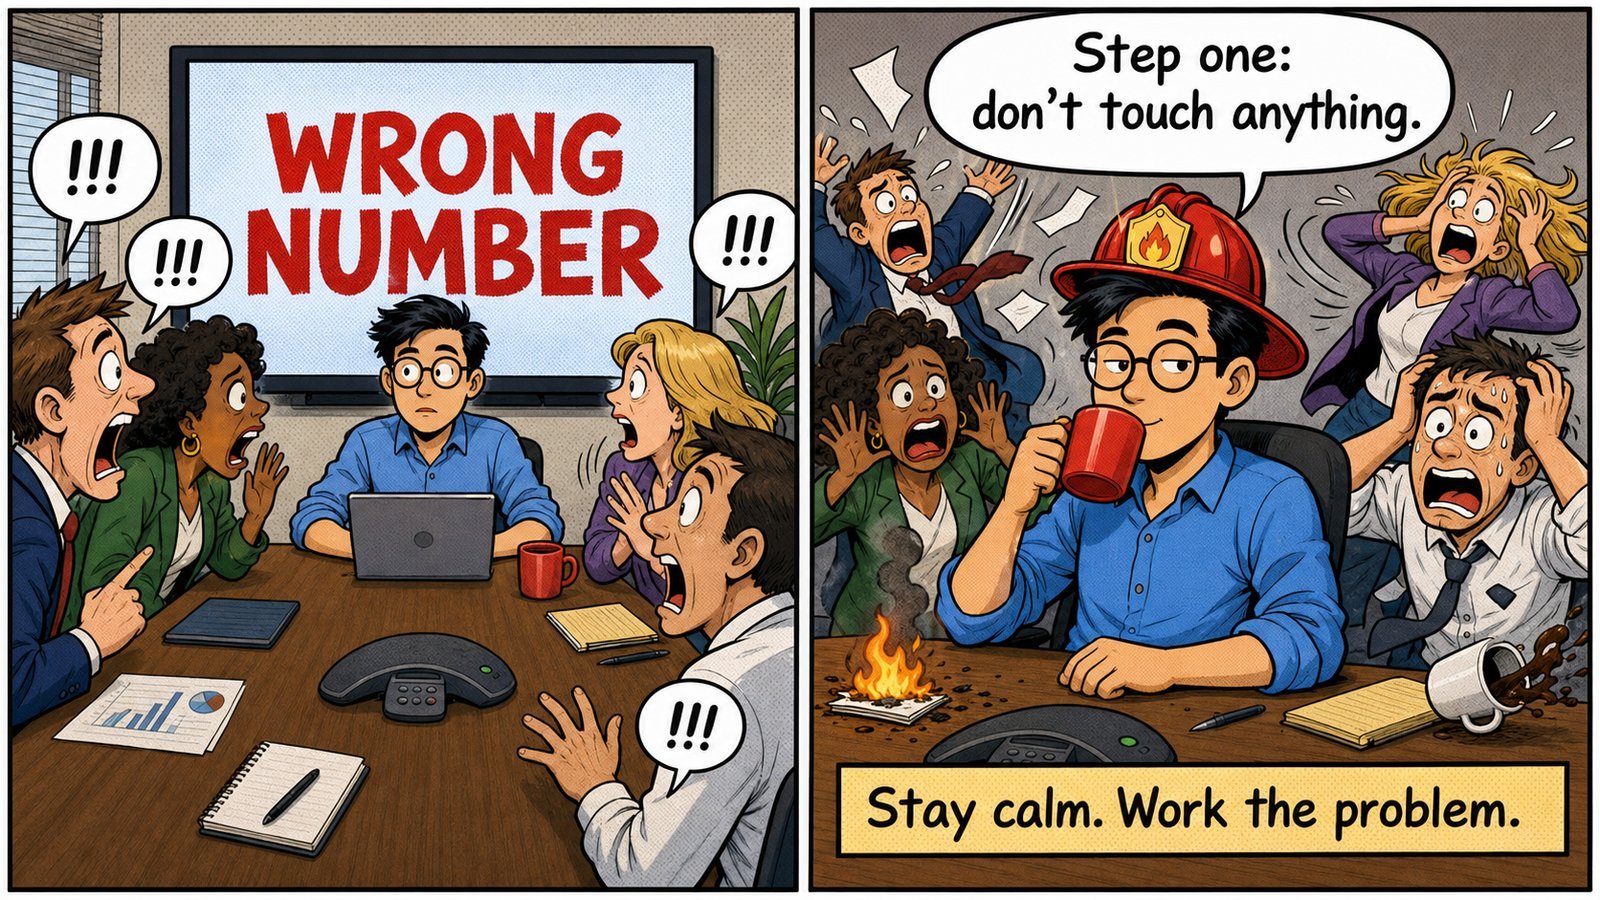
A wrong number in a live meeting makes everyone want to start changing things immediately. That instinct is how a one-hour fix becomes a three-day cleanup.
Triage first, because you cannot size a response until you know the blast radius. Contain before you fix, because cleaning while the tap runs is endless. Trace to the source instead of patching the number, or it comes back next week. Verify the fix, tell the people who trusted the bad value, and close with a short blameless review so the same break does not return.
The takeaway: changing the data is the middle of an incident, not the end.
Read the full post: You Just Found Bad Data in Production. Now What?
How the six fit together
Read as a set, they build on each other, because you cannot rank a problem you have not named, define a fix for one you have not ranked, or control one you have not defined. Understanding comes first, response comes last, and monitoring is the quiet layer that keeps the whole thing honest between incidents.
Here is the entire guide in one line each, if you ever need to find the right idea fast.
| When you hit this | Do this |
|---|---|
| The dashboard is “wrong” | Name it: quality, reliability, or observability |
| A long list of data errors | Rank by impact and likelihood, not by count |
| “Just make it clean” | Write a rule, a threshold, and a named owner |
| A check that fires too late | Put controls at ingestion, transformation, and the gate |
| Every test passed, it still broke | Monitor freshness, volume, schema, and distribution |
| A wrong number in production | Triage, contain, trace, verify, tell, review |
Start at the top, or jump to whichever problem is on fire today. Each post also carries a link to its companion Pluralsight course if you would rather see the idea built hands-on.
In short
Data quality and observability is not one skill but six connected moves. Name the problem before you chase it, because “the dashboard is wrong” hides three different failures: a wrong value, a late value, and a silent change. Rank issues by impact and likelihood, not by row count. Turn vague requests like “make it clean” into a rule, a threshold, and an owner. Place controls where they can stop bad data, not merely log it. Monitor the signals row-level tests miss: freshness, volume, schema, and distribution. And when something breaks anyway, respond calmly rather than fast. Read the six posts in order and you have a working playbook for trustworthy data, from the first disputed number to the last blameless review.
Published by Pinal Dave on SQLAuthority. More of my work at pinaldave.com.
Discover more from SQL Authority with Pinal Dave
Subscribe to get the latest posts sent to your email.