
The 5 Vs of Big Data are volume, velocity, variety, veracity and value. They’re five questions to ask about any data before you choose a tool. The first three came from a 2001 note on data management. The last two came later, because size alone never showed whether the data was any good.

Where the Vs Came From
In 2001, an analyst named Doug Laney described the pressure on data management with three words: volume, velocity and variety. The list stuck, and people called it the 3 Vs. Later writers added veracity and value, which gave us five.
These aren’t laws of nature. They’re a checklist for deciding whether a project needs a bigger server, a different design, or a cleaner source.
The first three describe the data itself: how much, how fast, and how many shapes. The last two describe your relationship with it. Can you trust it, and does it pay for itself? That split is why veracity and value matter to the business as much as to engineers.
One Example for All Five
To keep this concrete, picture a grocery chain with 400 stores. Every store has checkout lanes, a delivery app and a stockroom. We’ll run the chain through each V. The numbers are made up for the example, so read them as round figures.
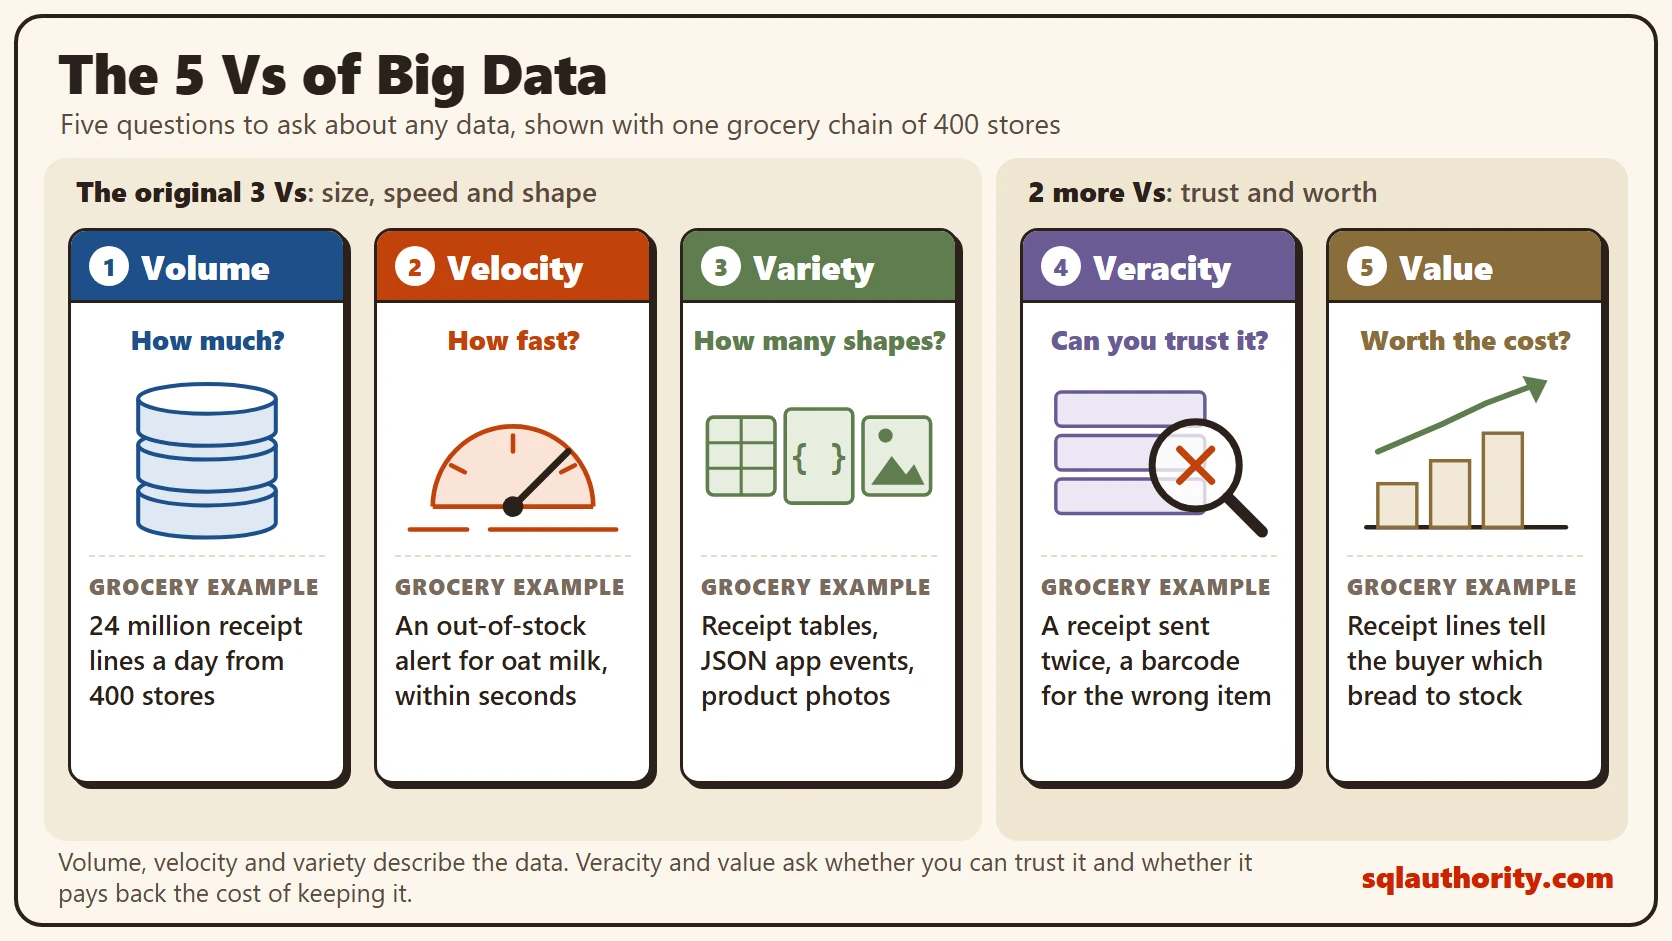
The diagram shows the five Vs as five cards in a row. Each card has a symbol and one example from this chain. Read it from left to right, because the next five sections follow the same order.
Volume: How Much
Say each store rings up 5,000 receipts a day, with 12 items on each receipt. That’s 60,000 lines per store and 24 million lines a day across the chain. In a year, that’s about 8.8 billion lines, before you add the app, the web store and the delivery routes.
Volume is the V people think of first, and it’s the easiest to measure. When data outgrows one machine’s disks or memory, you split it across many machines. At that point the design has to change, not only the hardware.
Velocity: How Fast
Velocity is how quickly data arrives and how quickly someone needs an answer. A weekly sales report can wait for a nightly load. A shelf alert that says the oat milk is gone can’t wait for the next load.
So velocity decides between batch and streaming. Batch collects data and processes it on a schedule. Streaming handles each event within seconds of its arrival. The faster you need the answer, the more the system costs to build and to run.
Variety: How Many Shapes
Our chain holds data in many shapes. Receipts fit neatly into tables. App events arrive as JSON, with fields that change from one release to the next. Product photos are images, supplier invoices are PDFs, and delivery trucks send a location every few seconds.
Variety is why one rigid table design can’t hold everything. Structured data goes in tables. Semi-structured data, such as JSON, needs a flexible format. Unstructured data, such as images, usually lives as files with a table of details next to it.
Veracity: Can You Trust It
Veracity asks whether the data is correct. A checkout lane retries after a network blip and sends the same receipt twice. A barcode points to the wrong product. Two systems disagree on how many stores the chain has.
Big data makes this worse, because nobody can read 24 million lines by eye. The fix is to build checks into the pipeline. Remove duplicates, test that prices are above zero, and flag any store that sends no data for a day. Untrusted data gives you confident answers that are wrong.
Value: Is It Worth the Cost
Value is the V people forget. Storing and processing data costs money, so every dataset should answer one question: which decision does it change? Receipt lines tell the buyer which bread to stock. Truck locations tell dispatch which route to change.
Some data has no decision attached to it. Keeping it forever is a cost with no return. Every large dataset should have a decision behind it. If nobody can name one, review that dataset first.
What Each V Pushes You Toward
| V | Question | It pushes you toward |
|---|---|---|
| Volume | How much? | Storage spread over many machines |
| Velocity | How fast? | Streaming instead of a nightly batch |
| Variety | How many shapes? | Flexible formats and files with details beside them |
| Veracity | Can we trust it? | Quality checks in the pipeline |
| Value | Is it worth the cost? | Keeping only what changes a decision |
How the Vs Pull Against Each Other
The 5 Vs of Big Data don’t sit side by side peacefully. They trade against each other. The faster the data arrives, the less time you have to check it, so velocity fights veracity. The more shapes you accept, the more ways a record can be wrong, so variety fights veracity too.
Volume and value pull apart in a different way. Every extra terabyte adds to the bill, and not every terabyte adds to the answers. A good design says which V matters most for each dataset and gives up a little of the others.
Are Five Vs Too Many, or Too Few?
A fair objection is that the Vs are a marketing list. Some lists add more of them, and a list that keeps growing isn’t much of a definition. That’s true. Treat the five as questions, not as a definition.
Drop any one and a blind spot appears. Skip veracity, and you build a fast, huge system that gives wrong answers. Skip value, and you build an expensive one nobody uses.
What to Remember
Run any data project through the five questions before you pick a tool. Volume and velocity tell you how big and how fast the system must be. Variety, veracity and value tell you whether it will be useful.
The next step is deciding where the data lands once it arrives. That’s the subject of Big Data Architecture Today: The Lakehouse and Medallion Layers.
The 5 Vs of Big Data are not a definition, they are five questions to ask before you build.
Published by Pinal Dave on SQLAuthority. More of my work at pinaldave.com.
Discover more from SQL Authority with Pinal Dave
Subscribe to get the latest posts sent to your email.



15 Comments. Leave new
Nice piece of info. Thank you!
Thanks Pinal for explanation of big data, earlier I hear about big data but it makes me more clear…thanks once again for your effort for writing on this excellent topic.
Suman
Great topic Pinal .. lookinf frwd to upcoming post !!!
Simple way of writing, Looking forward to see the upcoming topics!!!
This is pretty good explanation with a pretty clear thought, loved your approach and looking forward how you unpack things in another 29 days
Hello Pinal Dave.
We already used a term to describe the transformation from some data in information, called “Business Inteligence”. I understand “big data” could be more than just text information, but is there a specific difference between them ? Until now, look very similar, no ?
great peice of infromation
great piece of infromation
Thanks much for the information.
Hi Dave , You have explained it in very simple and effective manner . The example you are giving are really very easy to understand big data. Thanks
nice article for beginers
nice
thanks Nagasai.
This is a great information to be shared.
Nice article. My own understanding about big data matches with your definition.