Data binning turns a column of numbers into a few groups you can count, chart and explain. T-SQL gives you four ways to do it: fixed width, NTILE, CASE ranges and DATE_BUCKET for dates. This post runs all four on the same 882 orders and shows what each one tells you.

What a Bin Is
A bin is a range of values, and every value falls into exactly one bin. The edges of the range are the bin edges. A bin keeps the count and drops the detail inside it. The amounts 26.40 and 49.90 become one fact: “between 25 and 50”.
That loss is the point of data binning. A report with 882 amounts is noise. A report with eight bins shows the shape. Which bins you choose decides what the shape says, so let’s compare the methods side by side.
Build the Test
I ran everything here on SQL Server 2025. The table holds order amounts that are skewed on purpose. The amounts follow a cubic curve, so there are many small orders and a few large ones. Two details matter later. Some orders have an exact amount of 100.00, and a fortnight of dates has no orders at all.
IF DB_ID(N'SqlBinningDemo') IS NULL CREATE DATABASE SqlBinningDemo;
GO
USE SqlBinningDemo;
GO
DROP TABLE IF EXISTS dbo.Bands, dbo.Orders;
CREATE TABLE dbo.Orders
(
    OrderID int NOT NULL PRIMARY KEY,
    OrderDate date NOT NULL,
    Amount decimal(8,2) NOT NULL
);
GO
INSERT INTO dbo.Orders (OrderID, OrderDate, Amount)
SELECT g.OrderID, g.OrderDate, g.Amount
FROM (SELECT s.value AS OrderID,
             DATEADD(DAY, s.value * 7 % 120, '2026-01-01') AS OrderDate,
             CASE WHEN s.value % 50 = 0 THEN 100.00
                  ELSE CAST(5 + POWER(s.value * 37 % 1000 / 1000.0, 3) * 195 AS decimal(8,2)) END AS Amount
      FROM GENERATE_SERIES(1, 1000) AS s) AS g
WHERE g.OrderDate < '2026-02-02' OR g.OrderDate >= '2026-02-16';
GO
SELECT COUNT(*) AS Orders, MIN(Amount) AS MinAmount, MAX(Amount) AS MaxAmount FROM dbo.Orders;
GO| Orders | MinAmount | MaxAmount |
|---|---|---|
| 882 | 5.00 | 199.42 |
Fixed Width
Fixed width is the simplest method. Divide the value by the width, round down and multiply back. The result is the lower edge of the bin. Group by it and count.
SELECT FLOOR(Amount / 25) * 25 AS BinStart, COUNT(*) AS Orders
FROM dbo.Orders
GROUP BY FLOOR(Amount / 25) * 25
ORDER BY BinStart;
GO
| BinStart | Orders |
|---|---|
| 0 | 404 |
| 25 | 126 |
| 50 | 84 |
| 75 | 66 |
| 100 | 73 |
| 125 | 47 |
| 150 | 43 |
| 175 | 39 |
The bins have the same width and widely different counts. The first bin holds 404 of the 882 orders, which is 46 percent. Fixed width shows the shape of the data honestly. The small bump at 100 comes from the 18 orders with an exact amount of 100.00.
How Many Bins
The width is a choice, and it changes the story. This query bins the same orders with widths of 5, 25 and 100. For each width it reports how many bins appear and how full the largest and smallest are.
SELECT w.Width, COUNT(*) AS Bins, MAX(x.Orders) AS LargestBin, MIN(x.Orders) AS SmallestBin
FROM (VALUES (5), (25), (100)) AS w(Width)
CROSS APPLY (SELECT FLOOR(o.Amount / w.Width) AS BinNo, COUNT(*) AS Orders FROM dbo.Orders AS o GROUP BY FLOOR(o.Amount / w.Width)) AS x
GROUP BY w.Width
ORDER BY w.Width;
GO
| Width | Bins | LargestBin | SmallestBin |
|---|---|---|---|
| 5 | 39 | 254 | 7 |
| 25 | 8 | 404 | 39 |
| 100 | 2 | 680 | 202 |
A width of 100 gives two bins and says almost nothing. A width of 5 gives 39 bins, and the smallest holds only 7 orders, so the tail looks ragged. A width of 25 keeps the shape in eight bins. No width is perfect. Check the smallest bin: a bin with a handful of rows is a thin slice, not a pattern.
NTILE
NTILE does the opposite. You choose the number of bins, and it gives each bin the same number of rows. The edges follow the data. With four bins you get quartiles.
SELECT Quartile, MIN(Amount) AS LowAmount, MAX(Amount) AS HighAmount, COUNT(*) AS Orders
FROM (SELECT Amount, NTILE(4) OVER (ORDER BY Amount) AS Quartile FROM dbo.Orders) AS t
GROUP BY Quartile
ORDER BY Quartile;
GO
| Quartile | LowAmount | HighAmount | Orders |
|---|---|---|---|
| 1 | 5.00 | 8.31 | 221 |
| 2 | 8.35 | 31.48 | 221 |
| 3 | 31.64 | 92.99 | 220 |
| 4 | 93.33 | 199.42 | 220 |
882 does not divide by four, so the first two bins get one extra row. The widths tell the story: the first bin spans 3.31, the last spans 106.09. A quarter of all orders cost 8.31 or less. NTILE assigns rows by position, so two equal values can land in different bins. Do not use it when a boundary must be exact.
CASE Ranges
When the business already has names for its ranges, write them down with CASE. Each WHEN tests the upper edge, so a value falls into the first range that fits. The lower edge is implied by the line above.
SELECT CASE WHEN Amount < 20 THEN N'Small' WHEN Amount < 100 THEN N'Medium' ELSE N'Large' END AS Size, COUNT(*) AS Orders
FROM dbo.Orders
GROUP BY CASE WHEN Amount < 20 THEN N'Small' WHEN Amount < 100 THEN N'Medium' ELSE N'Large' END
ORDER BY MIN(Amount);
GO
| Size | Orders |
|---|---|
| Small | 367 |
| Medium | 313 |
| Large | 202 |
The three counts add up to 882. If the ranges change, move them into a small table and join to it. That join hides a trap. The next block builds the table and counts the orders twice: once with BETWEEN and once with explicit edges.
CREATE TABLE dbo.Bands (Size nvarchar(10) NOT NULL, LowAmount decimal(8,2) NOT NULL, HighAmount decimal(8,2) NOT NULL);
INSERT INTO dbo.Bands VALUES (N'Small', 0, 20), (N'Medium', 20, 100), (N'Large', 100, 1000);
SELECT COUNT(*) AS BetweenCount FROM dbo.Orders AS o JOIN dbo.Bands AS b ON o.Amount BETWEEN b.LowAmount AND b.HighAmount;
SELECT COUNT(*) AS HalfOpenCount FROM dbo.Orders AS o JOIN dbo.Bands AS b ON o.Amount >= b.LowAmount AND o.Amount < b.HighAmount;
GO
| BetweenCount | HalfOpenCount |
|---|---|
| 900 | 882 |
BETWEEN includes both ends. An amount of exactly 100.00 matched Medium and Large. So 18 orders were counted twice, and the total grew to 900. Use a closed lower edge and an open upper edge, as the second query does. Then every value lands in one bin.
DATE_BUCKET for Time
Dates need bins too: weeks, fortnights, quarters. DATE_BUCKET, new in SQL Server 2022, returns the start of the bucket a date falls into. You give it the unit, the width and a date. An optional origin sets where the buckets begin. Before SQL Server 2022, you built the bucket from DATEDIFF and DATEADD arithmetic.
SELECT DATE_BUCKET(WEEK, 2, OrderDate, CAST('2026-01-05' AS date)) AS BucketStart, COUNT(*) AS Orders
FROM dbo.Orders
GROUP BY DATE_BUCKET(WEEK, 2, OrderDate, CAST('2026-01-05' AS date))
ORDER BY BucketStart;
GO| BucketStart | Orders |
|---|---|
| 2025-12-22 | 32 |
| 2026-01-05 | 118 |
| 2026-01-19 | 118 |
| 2026-02-16 | 116 |
| 2026-03-02 | 116 |
| 2026-03-16 | 116 |
| 2026-03-30 | 116 |
| 2026-04-13 | 116 |
| 2026-04-27 | 34 |
The origin is a Monday, so every bucket starts on a Monday. The first bucket starts on 2025-12-22, before the first order. It holds only the 32 orders from 1 to 4 January. The last bucket is partial too. Look at the gap: the fortnight starting 2026-02-02 has no orders, so GROUP BY drops it. A chart would skip it without a warning.
Build the bucket list first, then join the orders to it. GENERATE_SERIES, also new in SQL Server 2022, makes ten buckets. The LEFT JOIN keeps the empty one with a zero.
SELECT DATEADD(WEEK, b.value * 2, CAST('2025-12-22' AS date)) AS BucketStart, COUNT(o.OrderID) AS Orders
FROM GENERATE_SERIES(0, 9) AS b
LEFT JOIN dbo.Orders AS o ON DATE_BUCKET(WEEK, 2, o.OrderDate, CAST('2026-01-05' AS date)) = DATEADD(WEEK, b.value * 2, CAST('2025-12-22' AS date))
GROUP BY b.value
ORDER BY b.value;
GO
The result has ten rows. The row for 2026-02-02 shows 0, and the other nine match the table above.
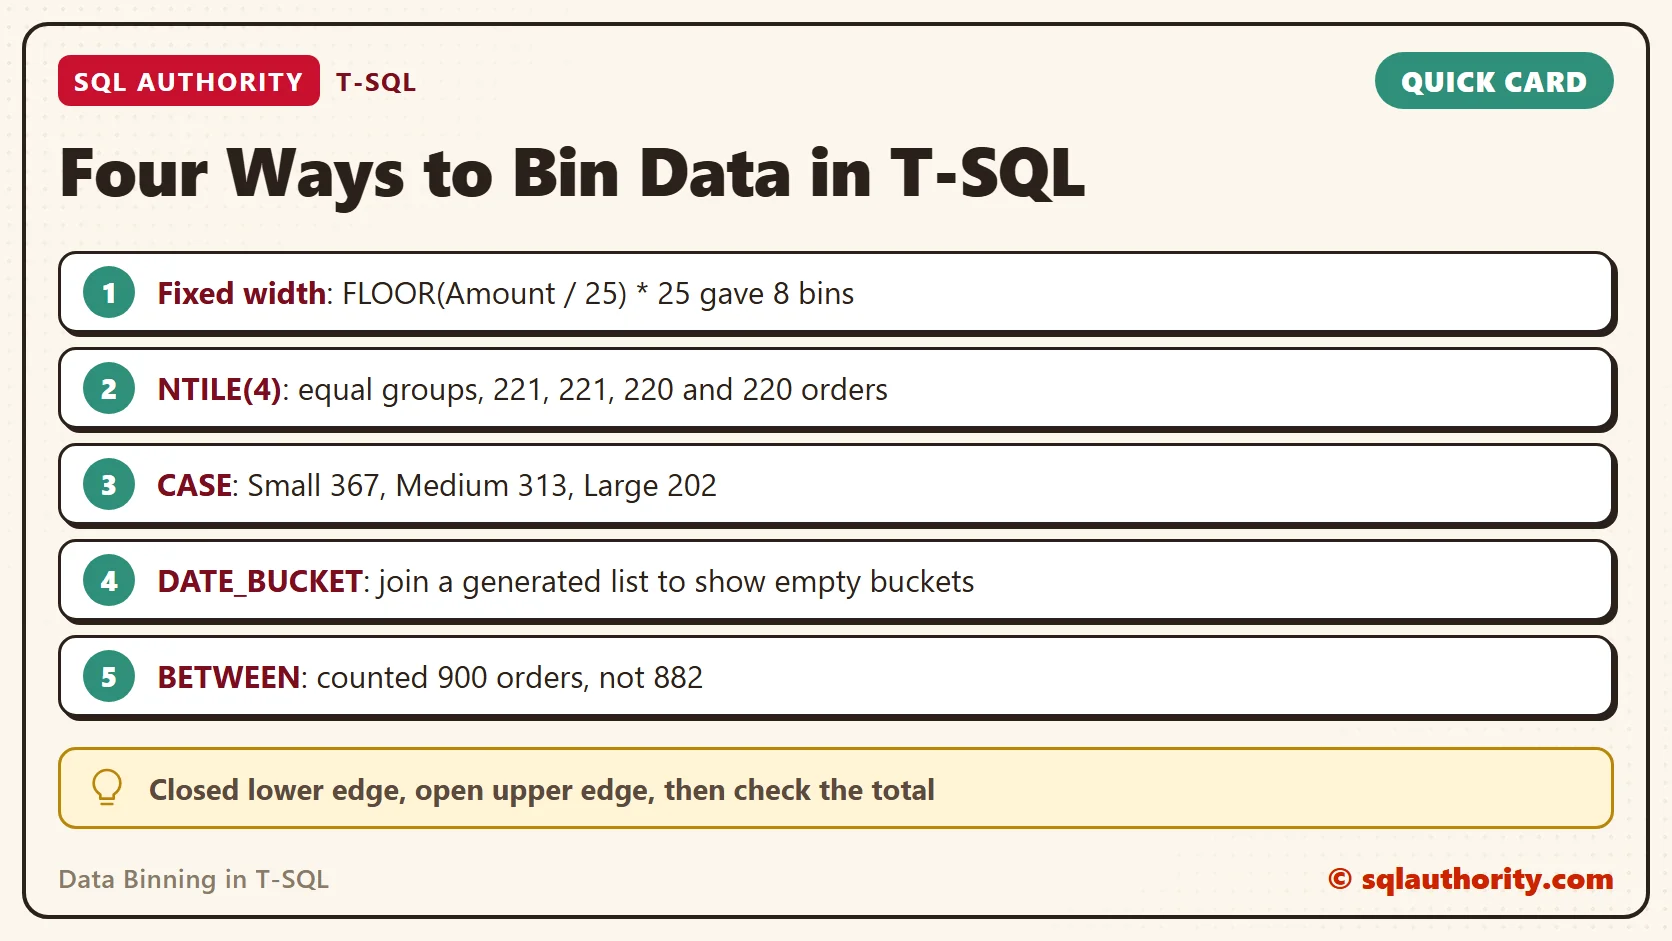
Is Binning Worth the Loss?
You could say data binning throws information away. Fair point. Two orders of 26 and 49 look alike once they sit in the same bin. The answer is to keep the raw column and bin in the query or in a view. Then you can move the edges tomorrow without reloading anything.
Start with edges the business already uses, then adjust. The table above shows why: too few bins hide the shape, and too many show noise.
A Short Checklist
Use this list to pick a method for your own data binning. Write the bin edges down before you run anything, and check that the counts add up to the row count. A total that is too high or too low means an edge is wrong.
- Fixed width: the data is spread evenly, or you want to see its true shape.
- NTILE: you want equal groups, such as quartiles, and exact edges do not matter.
- CASE or a band table: the ranges have business names.
- DATE_BUCKET: the bins are time units. Join to a generated list when empty buckets must show.
- Always use a closed lower edge and an open upper edge.
When you finish testing, remove the example database.
USE master;
GO
ALTER DATABASE SqlBinningDemo SET SINGLE_USER WITH ROLLBACK IMMEDIATE;
DROP DATABASE SqlBinningDemo;
A bin is not a smaller copy of your data, it is a question you ask of it.
Published by Pinal Dave on SQLAuthority. More of my work at pinaldave.com.
Discover more from SQL Authority with Pinal Dave
Subscribe to get the latest posts sent to your email.