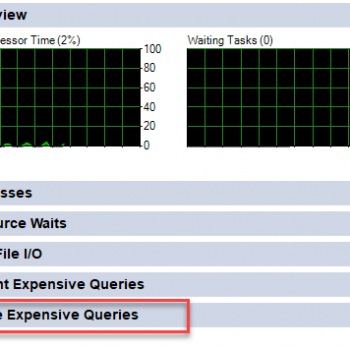
Today we are going to discuss Troubleshooting High CPU in SQL Server. This is one of the reasons why many hire me for Comprehensive Database Performance Health Check.

Step 1: Process Using CPU
It is quite possible that your SQL Server is installed on the machine where there are other windows applications are also installed and they are consuming your CPU. We can easily figure out which processes are using your CPU by just running the following query.
DECLARE @ms_ticks_now BIGINT
SELECT @ms_ticks_now = ms_ticks
FROM sys.dm_os_sys_info;
SELECT TOP 60 record_id
	,dateadd(ms, - 1 * (@ms_ticks_now - [timestamp]), GetDate()) AS EventTime
	,[SQLProcess (%)]
	,SystemIdle
	,100 - SystemIdle - [SQLProcess (%)] AS [OtherProcess (%)]
FROM (
	SELECT record.value('(./Record/@id)[1]', 'int') AS record_id
		,record.value('(./Record/SchedulerMonitorEvent/SystemHealth/SystemIdle)[1]', 'int') AS SystemIdle
		,record.value('(./Record/SchedulerMonitorEvent/SystemHealth/ProcessUtilization)[1]', 'int') AS [SQLProcess (%)]
		,TIMESTAMP
	FROM (
		SELECT TIMESTAMP
			,convert(XML, record) AS record
		FROM sys.dm_os_ring_buffers
		WHERE ring_buffer_type = N'RING_BUFFER_SCHEDULER_MONITOR'
			AND record LIKE '%<SystemHealth>%'
		) AS x
	) AS y
ORDER BY record_id DESC
This query will give you a clear idea about if your SQL Server is using CPU or any other process. If your SQL Server is using the CPU, you should further continue the investigation in SQL Server otherwise, you should start looking for processes consuming your CPU in windows application.
Currently, this script gives you details about the last 60 minutes. You can further configure it for your desired interval.
Step 2: Current Queries Using CPU
Once you are certain that your SQL Server is using the maximum CPU, you can run the following script to identify which query is taking the maximum CPU. Please note that this query will only look into the currently running queries only.
SELECT
	r.session_id
	,st.TEXT AS batch_text
	,SUBSTRING(st.TEXT, statement_start_offset / 2 + 1, (
			(
				CASE
					WHEN r.statement_end_offset = - 1
						THEN (LEN(CONVERT(NVARCHAR(max), st.TEXT)) * 2)
					ELSE r.statement_end_offset
					END
				) - r.statement_start_offset
			) / 2 + 1) AS statement_text
	,qp.query_plan AS 'XML Plan'
	,r.cpu_time, r.total_elapsed_time
	,r.logical_reads, r.writes, r.dop
FROM sys.dm_exec_requests r
CROSS APPLY sys.dm_exec_sql_text(r.sql_handle) AS st
CROSS APPLY sys.dm_exec_query_plan(r.plan_handle) AS qp
ORDER BY cpu_time DESC
The query above is currently ordered by CPU Time, you can change the order if you prefer and if you want to retrieve additional details about the query, you can easily find more details from DMV dm_exec_requests which is aliased as r in the query above.
Step 3: Historical Queries Using CPU
I am often hired by clients to help them investigate the history of the SQL Server. They want to know why in the past their SQL Server was running very high. In that case, you can run the following script to identify which query was taking the most amount of the CPU in the past.
SELECT TOP(10) qs.execution_count AS [Execution Count],
	(qs.total_logical_reads)/1000.0 AS [Total Logical Reads in ms],
	(qs.total_logical_reads/qs.execution_count)/1000.0 AS [Avg Logical Reads in ms],
	(qs.total_worker_time)/1000.0 AS [Total Worker Time in ms],
	(qs.total_worker_time/qs.execution_count)/1000.0 AS [Avg Worker Time in ms],
	(qs.total_elapsed_time)/1000.0 AS [Total Elapsed Time in ms],
	(qs.total_elapsed_time/qs.execution_count)/1000.0 AS [Avg Elapsed Time in ms],
	qs.creation_time AS [Creation Time]
	,t.text AS [Complete Query Text], qp.query_plan AS [Query Plan]
FROM sys.dm_exec_query_stats AS qs WITH (NOLOCK)
CROSS APPLY sys.dm_exec_sql_text(plan_handle) AS t
CROSS APPLY sys.dm_exec_query_plan(plan_handle) AS qp
WHERE t.dbid = DB_ID()
ORDER BY (qs.total_logical_reads/qs.execution_count) DESC;
The query above will retrieve data from your memory cache. This means if you clear your cache or if your server is restarted the data will be erased. You should not 100% depend on this for your investigation. However, from my experience, I have found that the result is pretty dependable.
Step 4: Fixing Query Performance
Once you identify which query is taking the maximum CPU you may consider tuning that query based on what you find offending in that query. You should focus on the following aspect, along with the execution plan operators when you are looking at query tuning exercise.
- Wait statistics of the session
- Scheduler workload
- IO stalling queries
- Memory grant for session
- Blocking scenarios
- Optional Max degree of parallelism for query
- Execution plan operators consuming a lot of CPU
- Ad-hoc workload of the server
- Parameter sniffing configuration
- etc.
Query tuning is not in the scope of this blog post, however, you are interested in this subject, you can watch my videos on YouTube about query tuning. If at any point in time, you are stuck or not able to move forward with your query tuning exercise, you can always reach out to me to help you. I usually answer very quickly to all the emails if I am not busy with Comprehensive Database Performance Health Check.
Let me know your thought about this blog post – Troubleshooting High CPU.
Reference: Pinal Dave (http://blog.SQLAuthority.com)


