Query progress for a running statement is visible in sys.dm_exec_query_profiles. It shows how many rows each operator has produced so far. So you can see where the work is, not just how long it has been running.

The query that has been running for an hour
Someone pings you: “Is it almost done?” The query has been running a long time. Elapsed time cannot answer that. It only says how long it has been going, not how far it has to go.
The DMV sys.dm_exec_query_profiles can help. For a running request it returns one row per operator and thread, with a live row_count next to estimate_row_count. You are reading the plan while it works.
Build a workload that runs for a long time
I need something slow that you can safely cancel. The demo makes a table of 60,000 rows and a procedure that joins it to itself. The join condition is a silly inequality on expressions, so every pair matches and SQL Server must loop through 3.6 billion pairs. The demo creates one table and one procedure in your database and drops both at the end. GENERATE_SERIES needs SQL Server 2022 or later.
DROP PROCEDURE IF EXISTS dbo.SlowJoin;
DROP TABLE IF EXISTS dbo.ProfileDemo;
GO
CREATE TABLE dbo.ProfileDemo (Id int PRIMARY KEY CLUSTERED, Pad char(50) NOT NULL DEFAULT 'x');

INSERT dbo.ProfileDemo (Id)
SELECT value FROM GENERATE_SERIES(1, 60000);
GO
CREATE PROCEDURE dbo.SlowJoin
AS
    SELECT COUNT_BIG(*) AS PairCount
    FROM dbo.ProfileDemo AS a
    JOIN dbo.ProfileDemo AS b ON a.Id + 0 <> b.Id + 0 - 100000
    OPTION (MAXDOP 1);
GO
Do not run the procedure in this window. First look at its estimated plan. SHOWPLAN_TEXT prints the plan without executing anything, which is a handy habit before any big query.
SET SHOWPLAN_TEXT ON;
GO
EXEC dbo.SlowJoin;
GO
SET SHOWPLAN_TEXT OFF;
GO
The plan is a Stream Aggregate on top of a Nested Loops join. The loop reads the table twice, and a Table Spool sits on the inner side to replay rows. That is the shape we will watch.
Watch it from a second window
Open two query windows in the same database. In window 1, run SELECT @@SPID;, note the number, then run SET STATISTICS PROFILE ON; EXEC dbo.SlowJoin;. It will run for many minutes, and you will cancel it later. In window 2, first look for the request.
SELECT r.session_id, r.status, r.command, r.start_time, r.cpu_time, r.total_elapsed_time,
       r.wait_type, r.blocking_session_id
FROM sys.dm_exec_requests AS r
JOIN sys.dm_exec_sessions AS s ON s.session_id = r.session_id
WHERE s.is_user_process = 1 AND r.session_id <> @@SPID AND r.database_id = DB_ID()
ORDER BY r.start_time, r.session_id;
If the list is empty, the query is not running, or it finished between samples. A request that completes simply disappears. Now read its operators. Put window 1’s number in @SessionId. If you leave it NULL, the query picks the longest-running other user request in this database. If there is none, it returns nothing. The IS NOT NULL test matters, because a NULL id would make the DMV return every profiled session.
DECLARE @SessionId int = NULL;

SELECT @SessionId = COALESCE(@SessionId,
       (SELECT TOP (1) r.session_id
        FROM sys.dm_exec_requests AS r
        JOIN sys.dm_exec_sessions AS s ON s.session_id = r.session_id
        WHERE s.is_user_process = 1 AND r.session_id <> @@SPID AND r.database_id = DB_ID()
        ORDER BY r.total_elapsed_time DESC, r.session_id));

SELECT session_id, node_id, thread_id, physical_operator_name,
       row_count, estimate_row_count, elapsed_time_ms, cpu_time_ms
FROM sys.dm_exec_query_profiles
WHERE session_id = @SessionId AND @SessionId IS NOT NULL
ORDER BY node_id, thread_id;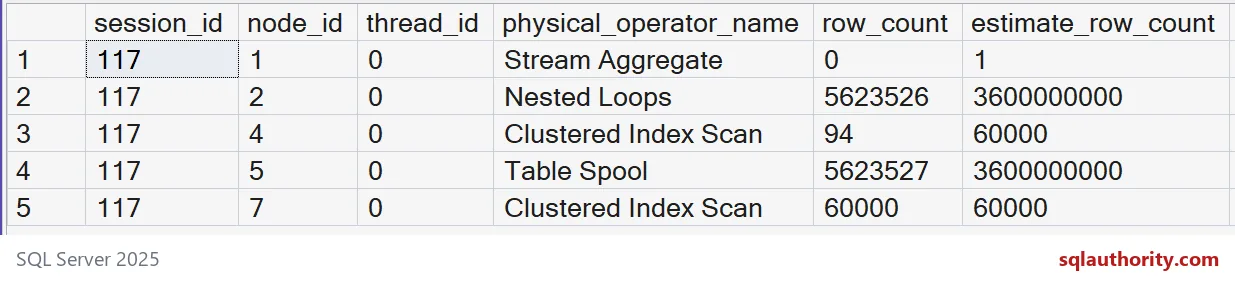
Here is how to read my capture. The Stream Aggregate shows zero rows, because it only outputs once, at the end. The Nested Loops and Table Spool have produced millions of rows against an estimate of 3.6 billion. The inner scan has finished its 60,000 rows, but the outer scan has barely started. All rows show thread 0, because the query ran with one worker.

Turn rows into a progress guide
Dividing row_count by estimate_row_count gives a rough progress per operator. NULLIF avoids a divide-by-zero. I do not cap the value at 100 percent, because a number above 100 is a useful clue: the estimate was too low.
DECLARE @SessionId int = NULL;

SELECT @SessionId = COALESCE(@SessionId,
       (SELECT TOP (1) r.session_id
        FROM sys.dm_exec_requests AS r
        JOIN sys.dm_exec_sessions AS s ON s.session_id = r.session_id
        WHERE s.is_user_process = 1 AND r.session_id <> @@SPID AND r.database_id = DB_ID()
        ORDER BY r.total_elapsed_time DESC, r.session_id));

SELECT node_id, physical_operator_name,
       SUM(row_count) AS CompletedRows,
       SUM(estimate_row_count) AS EstimatedRowsAcrossEntries,
       100.0 * SUM(row_count) / NULLIF(SUM(estimate_row_count), 0) AS RowProgressPercent
FROM sys.dm_exec_query_profiles
WHERE session_id = @SessionId AND @SessionId IS NOT NULL
GROUP BY node_id, physical_operator_name
ORDER BY node_id;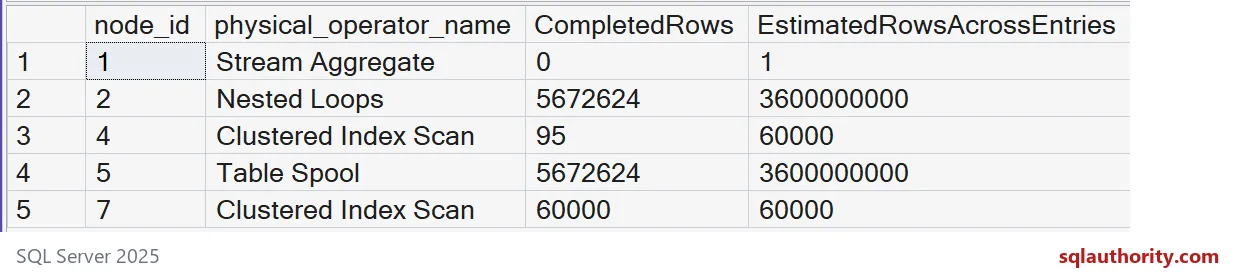
Two operators tell opposite stories. The inner scan sits at 100 percent because it only runs once. The Nested Loops sits at a tiny fraction of its estimate. Neither number is the finish line. The first is done early, and the second is the real work.
Read the numbers with care
The estimate is not a promise. If it is badly wrong, the percentage is wrong too. A zero at an aggregate does not mean it is idle. It means it has not output anything yet. For a parallel plan, look at each thread before you add them up. This demo used one worker, so it says nothing about how a parallel plan shares work.
One more habit. Sample at a sensible interval and only for one session. A tight loop that reads every profile row on the server becomes a workload of its own. When you have your answer, press Stop in window 1 and clean up.
DROP PROCEDURE IF EXISTS dbo.SlowJoin;
DROP TABLE IF EXISTS dbo.ProfileDemo;
Next time someone asks if it is almost done, look at the operators first.
An operator percentage is not a finish-time promise, it is progress against an estimate.
Published by Pinal Dave on SQLAuthority. More of my work at pinaldave.com.
Discover more from SQL Authority with Pinal Dave
Subscribe to get the latest posts sent to your email.