When a SQL Server cluster resource stays in Online Pending for minutes, the wait can come from database recovery. The cluster log and the error log show where the time goes.

What Online Pending Means
A clustered SQL Server resource moves through states. Online Pending is one of them. In Online Pending, the cluster has started the service. The service isn’t ready to accept connections yet. A short stay is normal. A stay of many minutes is a problem, because the instance is down for all that time.
This is a different situation from a resource that never comes online. There the resource fails, and typical causes are an account, a disk or a dependency. Here the resource does come online in the end. It takes far too long. The case below follows one such failover from the first event to the cause.
Read the Cluster Events First
Start with the failover cluster events on both nodes. In this case, the cluster service took the resource offline on Node1. It later brought the resource online on Node2. The two events show the length of the outage.
| Event ID | Node | Time | Message |
|---|---|---|---|
| 1204 | Node1 | 1:49:29 PM | The Cluster service successfully brought the clustered service or application ‘SQL Server (MSSQLSERVER)’ offline. |
| 1201 | Node2 | 1:57:11 PM | The Cluster service successfully brought the clustered service or application ‘SQL Server (MSSQLSERVER)’ online. |
The two events are about 8 minutes apart. A failover that works properly finishes much faster. The next step is the cluster log. Generate it with the PowerShell cmdlet Get-ClusterLog. Search it for the SQL Server resource around the times above.
What the Cluster Log Shows
The log holds a run of lines from the SQL Server resource DLL. Each line reports a status checkpoint that rose by one, from 0 to 1, then from 1 to 2. The wait hint on every line is 20000. The count rose about 40 times, with a gap of about two seconds between lines. These lines mean the service is still starting, and the cluster is waiting for it. The block below shows two of them. It is output, not code to run.
[sqsrvres] Service status checkpoint was changed from 0 to 1 (wait hint 20000). Pid is 2431
[sqsrvres] Service status checkpoint was changed from 1 to 2 (wait hint 20000). Pid is 2431
After the last checkpoint, the lines change. The service reports that it started, then that it connected to SQL Server. Diagnostics start, and the system health state moves from empty to clean. At the end, the resource state moves from ClusterResourceOnlinePending to ClusterResourceOnline. The final line, TransitionToState OnlinePending-->Online, closes the case in the log. Nothing in these lines names a cause, so the SQL Server error log comes next.
The Cause: Recovery of a Log With Too Many VLFs
The error log of the instance holds recovery messages for the full 8 minutes. It also shows that the log files had a huge number of virtual log files, called VLFs. A log file is split into VLFs, and recovery reads them one by one. Many small VLFs make startup, recovery and restore slow. In this case the VLF count was the likely root cause, and fixing it ended the delay.
VLFs multiply when a log grows in many small steps. The next demo shows it. It creates a database named LogFragmentDemo for this post only. The log grows by 1 MB at a time, so any large transaction forces many growths. The first query counts VLFs with sys.dm_db_log_info, which needs SQL Server 2016 SP2 or later. Older versions use the undocumented DBCC LOGINFO.
USE master;
IF DB_ID(N'LogFragmentDemo') IS NULL CREATE DATABASE LogFragmentDemo;
GO
ALTER DATABASE LogFragmentDemo SET RECOVERY SIMPLE;
ALTER DATABASE LogFragmentDemo MODIFY FILE (NAME = N'LogFragmentDemo_log', FILEGROWTH = 1MB);
GO
USE LogFragmentDemo;
GO
SELECT COUNT(*) AS VlfCount, CAST(SUM(vlf_size_mb) AS decimal(10, 2)) AS LogMb FROM sys.dm_db_log_info(DB_ID());
| VlfCount | LogMb |
|---|---|
| 4 | 7.96 |
A fresh database has 4 VLFs in a log of about 8 MB. Now one large transaction inserts 150,000 rows of 400 bytes each. The log has to grow to hold them, 1 MB at a time.
SET NOCOUNT ON;
DROP TABLE IF EXISTS dbo.Filler;
CREATE TABLE dbo.Filler (ID int IDENTITY(1,1) PRIMARY KEY, Pad char(400) NOT NULL DEFAULT 'x');
BEGIN TRANSACTION;
INSERT INTO dbo.Filler (Pad)
SELECT TOP (150000) 'x' FROM sys.all_objects AS a CROSS JOIN sys.all_objects AS b;
COMMIT TRANSACTION;
GO
SELECT COUNT(*) AS VlfCount, CAST(SUM(vlf_size_mb) AS decimal(10, 2)) AS LogMb FROM sys.dm_db_log_info(DB_ID());
| VlfCount | LogMb |
|---|---|
| 218 | 221.96 |
One transaction made 218 VLFs. A production log that grew in small steps for years can reach thousands. The counts vary a little from run to run. Every database on a server has its own count, and this query lists them from the highest down. Run it and look at the top of the list.
SELECT d.name AS DatabaseName, COUNT(*) AS VlfCount
FROM sys.databases AS d
CROSS APPLY sys.dm_db_log_info(d.database_id) AS li
GROUP BY d.name
ORDER BY VlfCount DESC;
The Fix: Fewer, Bigger VLFs
The fix has two parts. First, empty the log and shrink it, which removes the many small VLFs. Second, grow it back in a few large steps. In FULL recovery, take a log backup first, because the log can’t shrink past records that a backup hasn’t saved. This demo database uses SIMPLE recovery, so a CHECKPOINT does the same job.
CHECKPOINT;
DBCC SHRINKFILE (N'LogFragmentDemo_log', 1) WITH NO_INFOMSGS;
GO
SELECT COUNT(*) AS VlfCount, CAST(SUM(vlf_size_mb) AS decimal(10, 2)) AS LogMb FROM sys.dm_db_log_info(DB_ID());
| VlfCount | LogMb |
|---|---|
| 2 | 3.86 |
The log is back to 2 VLFs. Now grow it to the size the workload needs, in one step. Set a large growth amount for the future too. Pick the size from your own log use. The demo uses 512 MB.
USE master;
ALTER DATABASE LogFragmentDemo MODIFY FILE (NAME = N'LogFragmentDemo_log', SIZE = 512MB, FILEGROWTH = 256MB);
GO
USE LogFragmentDemo;
GO
SELECT COUNT(*) AS VlfCount, CAST(SUM(vlf_size_mb) AS decimal(10, 2)) AS LogMb FROM sys.dm_db_log_info(DB_ID());
| VlfCount | LogMb |
|---|---|
| 10 | 511.97 |
The log is now 512 MB with only 10 VLFs, compared with 218 VLFs for 222 MB before. In the case above, the same two steps, log backups and a shrink, reduced the VLF count. The next failover was quick, because recovery had far fewer pieces to read.
Could Something Else Cause the Delay?
You could argue that VLFs are only one cause. That’s right. A long recovery can also come from a large open transaction at failover time. Slow storage on the new node is another cause. The error log decides. If its recovery messages show one database taking nearly all the time, count the VLFs of that database first. If the counts are low, look at the transactions and the disks.
What to Remember
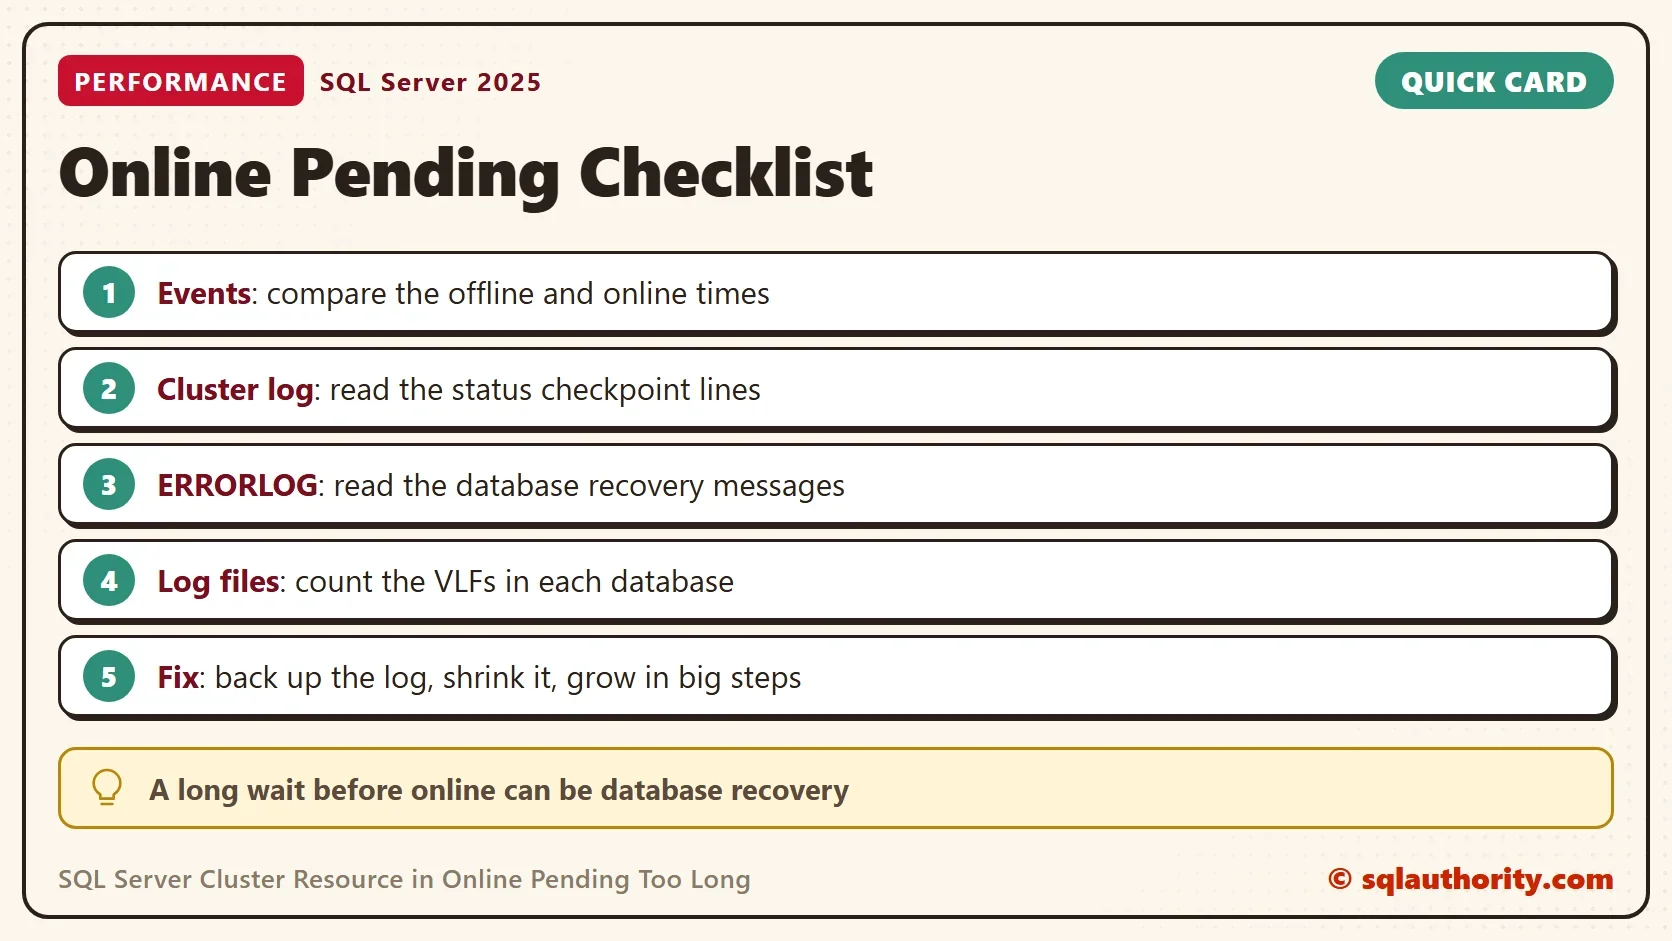
Compare the offline and online event times to measure the outage. Use the cluster log to confirm that the service is still starting. Use the error log to see which database recovers slowly. When the answer is a log with thousands of VLFs, back up the log and shrink it. Then grow it in large steps.
Set a sensible initial size and a large growth amount on every new database, so the problem doesn’t return. When you finish with the demo, run the cleanup script.
USE master;
GO
IF DB_ID(N'LogFragmentDemo') IS NOT NULL
BEGIN
    ALTER DATABASE LogFragmentDemo SET SINGLE_USER WITH ROLLBACK IMMEDIATE;
    DROP DATABASE LogFragmentDemo;
END;
A slow failover is not a mystery, it is a log you can count.
Published by Pinal Dave on SQLAuthority. More of my work at pinaldave.com.
Discover more from SQL Authority with Pinal Dave
Subscribe to get the latest posts sent to your email.