
Measure page splits with T-SQL by reading the Page Splits/sec counter twice and subtracting the first reading from the second. One reading alone tells you nothing. Two readings tell you how many splits a workload caused.

What a Page Split Is
SQL Server stores index rows on 8 KB pages, in key order. When a row belongs on a full page, SQL Server allocates a new page. It moves about half of the rows onto it. That costs extra reads, writes and log. It also leaves two half-empty pages behind.
Splits are normal. The question is how many a workload causes. Splits in the middle of an index hurt. Splits at the end are only growth.
Read the Counter
The counter lives in sys.dm_os_performance_counters. The object name starts with the instance name, which is why the query matches it with LIKE. The column cntr_type says what kind of number you are reading. Here it is 272696576, a running total since the instance started. The name says per second, but the value is a total. The older view sys.sysperfinfo returns the same number, but it is a compatibility view, so use the newer one.
To measure page splits, first build a test database with two tables. Each row carries a 300 byte note, so a page holds about 24 rows.
IF DB_ID(N'PageSplitDemo') IS NULL CREATE DATABASE PageSplitDemo;
GO
USE PageSplitDemo;
GO
DROP TABLE IF EXISTS dbo.OrdersSequential;
DROP TABLE IF EXISTS dbo.OrdersRandom;
CREATE TABLE dbo.OrdersSequential (
    OrderKey uniqueidentifier NOT NULL DEFAULT NEWSEQUENTIALID() PRIMARY KEY,
    Note     char(300)        NOT NULL DEFAULT 'filler'
);
CREATE TABLE dbo.OrdersRandom (
    OrderKey uniqueidentifier NOT NULL DEFAULT NEWID() PRIMARY KEY,
    Note     char(300)        NOT NULL DEFAULT 'filler'
);
Now read the counter. This needs the VIEW SERVER STATE permission, or VIEW SERVER PERFORMANCE STATE on SQL Server 2022 and later.
SELECT RTRIM(object_name) AS object_name, RTRIM(counter_name) AS counter_name, cntr_value, cntr_type
FROM sys.dm_os_performance_counters
WHERE counter_name = N'Page Splits/sec' AND object_name LIKE N'%Access Methods%';
| object_name | counter_name | cntr_value | cntr_type |
|---|---|---|---|
| MSSQL$SQLDEV:Access Methods | Page Splits/sec | 7466141 | 272696576 |
Your value will differ. Run the demo on a quiet instance, because the counter covers every database since the last restart. Only the difference between two readings is useful.
Measure Page Splits During a Load
Each table gets 5,000 rows, one row per INSERT, so every row finds its own place. The first table uses NEWSEQUENTIALID() keys, which only grow. The second uses NEWID() keys, which land anywhere in the index. The script reads the counter before and after each load.
SET NOCOUNT ON;
DECLARE @t TABLE (LoadType varchar(20), Splits bigint);
DECLARE @before bigint, @i int = 0;
SELECT @before = cntr_value FROM sys.dm_os_performance_counters
WHERE counter_name = N'Page Splits/sec' AND object_name LIKE N'%Access Methods%';
BEGIN TRANSACTION;
WHILE @i < 5000 BEGIN INSERT INTO dbo.OrdersSequential DEFAULT VALUES; SET @i += 1; END;
COMMIT;
INSERT INTO @t SELECT 'Sequential key', cntr_value - @before FROM sys.dm_os_performance_counters
WHERE counter_name = N'Page Splits/sec' AND object_name LIKE N'%Access Methods%';
SET @i = 0;
SELECT @before = cntr_value FROM sys.dm_os_performance_counters
WHERE counter_name = N'Page Splits/sec' AND object_name LIKE N'%Access Methods%';
BEGIN TRANSACTION;
WHILE @i < 5000 BEGIN INSERT INTO dbo.OrdersRandom DEFAULT VALUES; SET @i += 1; END;
COMMIT;
INSERT INTO @t SELECT 'Random key', cntr_value - @before FROM sys.dm_os_performance_counters
WHERE counter_name = N'Page Splits/sec' AND object_name LIKE N'%Access Methods%';
SELECT t.LoadType, t.Splits AS SplitsCounted
FROM @t t;
| LoadType | SplitsCounted |
|---|---|
| Sequential key | 211 |
| Random key | 308 |
The sequential load still counted 211 splits, yet nothing was split in the middle. The counter also counts each new page added at the end of an index, because the last page was full. That is growth, and it is the baseline for these 5,000 rows. The random load counted about 100 more in the test. Those are the splits that cost something.
The next query shows what they left behind. The random table needs almost half as many pages again, and each page is far emptier.
SELECT OBJECT_NAME(object_id) AS TableName, page_count AS Pages,
       CAST(avg_page_space_used_in_percent AS decimal(5,1)) AS AvgPageFullPct
FROM sys.dm_db_index_physical_stats(DB_ID(), NULL, NULL, NULL, 'DETAILED')
WHERE index_level = 0 AND object_id IN (OBJECT_ID(N'dbo.OrdersSequential'), OBJECT_ID(N'dbo.OrdersRandom'))
ORDER BY TableName DESC;| TableName | Pages | AvgPageFullPct |
|---|---|---|
| OrdersSequential | 209 | 96.0 |
| OrdersRandom | 305 | 65.8 |
Find the Index Behind the Splits
The instance counter can’t say which index split. sys.dm_db_index_operational_stats can. Its leaf_allocation_count column counts the pages each index has allocated. A page allocated because another was full is a split. In this demo the number equals the page count, because each table has one index.
SELECT OBJECT_NAME(object_id) AS TableName, leaf_allocation_count, nonleaf_allocation_count
FROM sys.dm_db_index_operational_stats(DB_ID(), NULL, NULL, NULL)
WHERE object_id IN (OBJECT_ID(N'dbo.OrdersSequential'), OBJECT_ID(N'dbo.OrdersRandom'));
| TableName | leaf_allocation_count | nonleaf_allocation_count |
|---|---|---|
| OrdersSequential | 209 | 1 |
| OrdersRandom | 305 | 1 |
These counters restart with the instance, so read them as a history since the last restart. To measure page splits for a single statement, use the Extended Events event page_split. It reports each split with its type.
Good and Bad Values
No single number separates healthy from unhealthy. A busy server inserting sequential keys counts thousands of splits and is fine. A quiet server with a few hundred middle-of-index splits an hour can still have slow reports. Compare the rate with a baseline for the same workload, and watch the trend.
Cut the splits at the source. Keys that only grow add pages at the end. A lower fill factor leaves free space on each page. Updates that make a row longer, such as filling in a varchar column later, split pages too. The next script rebuilds the random table at fill factor 100, then at 70. After each rebuild, it counts the splits from 1,000 more random inserts.
SET NOCOUNT ON;
DECLARE @t TABLE (FillFactorUsed int, Splits bigint);
DECLARE @ff int, @before bigint, @i int;
DECLARE @sql nvarchar(200);
DECLARE ff CURSOR LOCAL FAST_FORWARD FOR SELECT v FROM (VALUES (100), (70)) x(v);
OPEN ff; FETCH NEXT FROM ff INTO @ff;
WHILE @@FETCH_STATUS = 0
BEGIN
    SET @sql = N'ALTER INDEX ALL ON dbo.OrdersRandom REBUILD WITH (FILLFACTOR = ' + CAST(@ff AS nvarchar(3)) + N');';
    EXEC (@sql);
    SELECT @before = cntr_value FROM sys.dm_os_performance_counters
    WHERE counter_name = N'Page Splits/sec' AND object_name LIKE N'%Access Methods%';
    SET @i = 0;
    BEGIN TRANSACTION;
    WHILE @i < 1000 BEGIN INSERT INTO dbo.OrdersRandom DEFAULT VALUES; SET @i += 1; END;
    COMMIT;
    INSERT INTO @t SELECT @ff, cntr_value - @before FROM sys.dm_os_performance_counters
    WHERE counter_name = N'Page Splits/sec' AND object_name LIKE N'%Access Methods%';
    FETCH NEXT FROM ff INTO @ff;
END;
CLOSE ff; DEALLOCATE ff;
SELECT FillFactorUsed, Splits AS SplitsForNext1000Rows FROM @t;| FillFactorUsed | SplitsForNext1000Rows |
|---|---|
| 100 | 213 |
| 70 | 16 |
At fill factor 100, the 1,000 inserts counted 213 splits. At 70, they counted only 16, because most pages had room. The price is about a third more pages to read. Apply it to the indexes that split, not to every index.
Why Not Use Performance Monitor?
You could argue that Performance Monitor already shows this counter as a rate. It does, and for a quick look it’s fine. T-SQL has one advantage: a scheduled job can write the reading into a table every minute. Then you have a history to compare with, and a sudden jump has a timestamp.
What to Remember
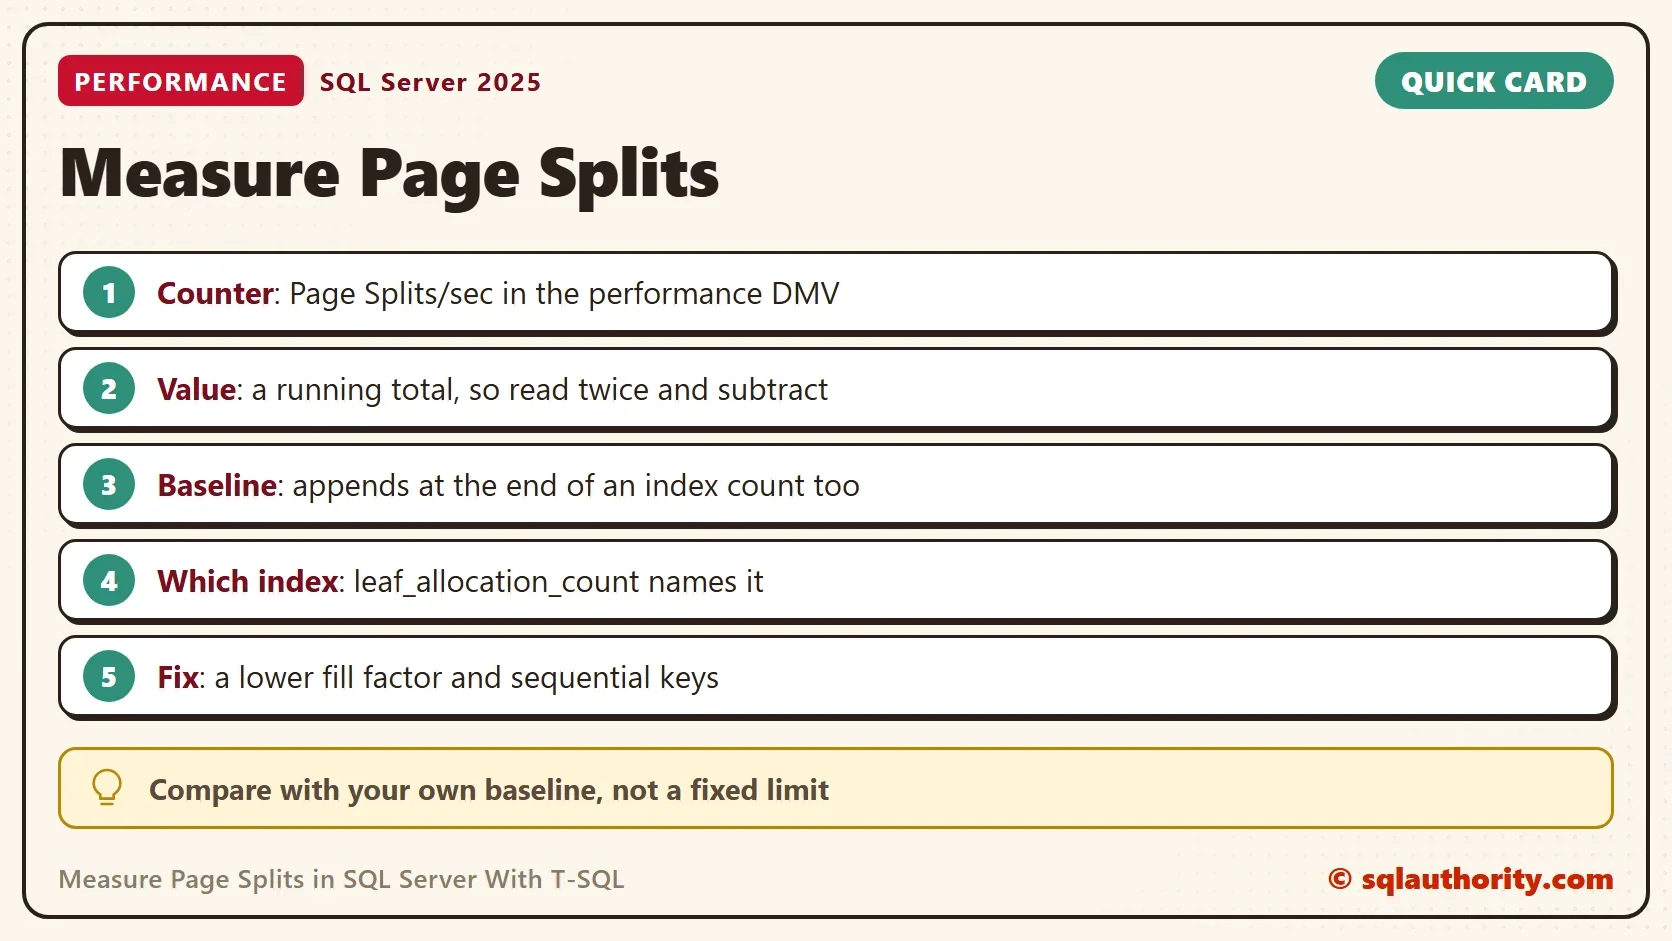
To measure page splits, read the counter twice and subtract. Treat the first reading as meaningless on its own. Record a baseline with sequential inserts, so you know how many splits plain growth causes. Anything above that baseline is worth a look.
When the counter climbs, find the index with leaf_allocation_count before you change anything. Then try a lower fill factor on that index or a key that only grows. When you finish with the demo, drop the test database.
USE master;
GO
ALTER DATABASE PageSplitDemo SET SINGLE_USER WITH ROLLBACK IMMEDIATE;
DROP DATABASE PageSplitDemo;
A page split is not a failure, it is a bill you can read before it grows.
Published by Pinal Dave on SQLAuthority. More of my work at pinaldave.com.
Discover more from SQL Authority with Pinal Dave
Subscribe to get the latest posts sent to your email.




5 Comments. Leave new
Good one
@Panaganti – Thanks
What would be the good and bad values range?
What can we do to fix this?
There are tons of article on internet which explain it in detail. Comment would not be a right place for it.
Can you post a link to one of the articles, there is so much garbage on the internet you could save us hours of searching….