
Interview question: How can you see how many rows a query returned, together with its execution plan?
Answer: For completed statements whose plans are still cached, sys.dm_exec_query_stats exposes total_rows, last_rows, min_rows, and max_rows. Join its plan handle to sys.dm_exec_query_plan to open the cached plan.

During performance-tuning engagements I am often asked for this report. It is useful, but the number of rows returned is not the same as the work done. A query can read a million rows and return one. I also check logical reads and worker time before calling a query cheap or expensive.
Here is the original query and its original SSMS result. The last column is an XML plan link in SSMS. The picture is a historical capture, so its row counts describe that instance’s plan cache at that moment, not a result to expect on every server.
SELECT DB_NAME(qt.dbid) AS database_name,
       qs.execution_count,
       qt.text AS query_text,
       qs.total_rows,
       qs.last_rows,
       qs.min_rows,
       qs.max_rows,
       qp.query_plan
FROM sys.dm_exec_query_stats AS qs
CROSS APPLY sys.dm_exec_sql_text(qs.plan_handle) AS qt
CROSS APPLY sys.dm_exec_query_plan(qs.plan_handle) AS qp
ORDER BY qs.execution_count DESC;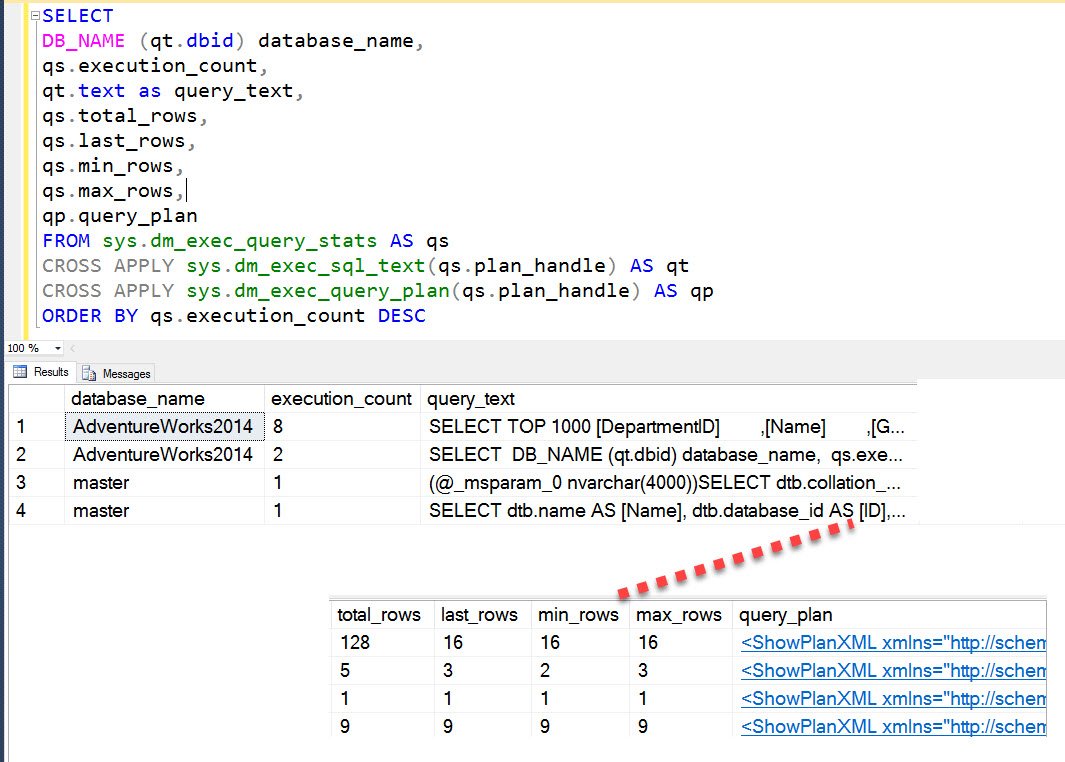
To inspect other sessions or cached execution statistics, use VIEW SERVER PERFORMANCE STATE on SQL Server 2022 and later, or VIEW SERVER STATE on earlier versions.
The DMV has one row per cached statement plan, but qt.text can contain the whole batch. If a batch has several statements, use statement_start_offset and statement_end_offset to isolate the statement you intend to tune. total_rows is accumulated over that cached entry’s completed executions; last_rows is from its last completed execution. The minimum and maximum show the range observed for that entry.
The numbers are tied to the plan’s lifetime in cache. An evicted or recompiled plan loses its entry, and a query still running is not reflected yet. This is why the report is a starting point, not a permanent count of all rows ever returned. My expensive-query DMV example is useful when the question is about reads and CPU instead.
Published by Pinal Dave on SQLAuthority. More of my work at pinaldave.com.
Discover more from SQL Authority with Pinal Dave
Subscribe to get the latest posts sent to your email.



3 Comments. Leave new
Hi Pinal sir,
Its my pleasure I am writing you. Thanks for your useful stuffs, it really helps the folks a lot.
Sir, recently one of my friends was asked a question during the interview, we searched it everywhere but did not find any satisfactory answer. Then I decided to bring it up with you and I am sure we would be getting our answer here. The question being-:
‘ I am having a very long query( nearly about 2 pages) and it contains many sub queries. Now I discover that my query is taking a lot of time. I want to know which part of my query is taking time or running slow in fetching the data’
I have found that most of the questions in an interview are similar to performance only, like how to boost performance of your queries, how to do performance tuning and all.
it would be great of you could provide me some links for the same.
Regards
Himanshu
Run sp_whoisactive
It will give you the exact portion of the code thats running at the time including what its waiting on and more
Crack open the execution plan which will reveal more information about operators used and go from there
If youre running on SQL 2016, consider enabling query store
How to get Total Rows Per Execution of Single Query/Queries?